¶ Introduction
Network Map is a very powerful tool for graphical representation of your monitored services. You can upload images and create a map that will represent different portions of your network, or take a picture of your switches, routers, servers, etc.. and use it. You can give your imagination free reign to create all kinds of illustrations.
This software can be applied to a variety of business IT processes. These include:
- Representation of a logical network view with correlating current states
- Creation of simplified views for end users or help desk
- Visualization of network connections or VPN routes
- Summary information from an entire physical site or data center in a regional view
- Link status information with the server rack location
- View hardware and correlating monitoring states
To make using the Network Map tool easier, we recommend starting your learning process in this order:
- Create a background
- Create a map
- Manage shapes
- Add an icon representing a host
- Add some informational text
¶ Guideline to use the Network Map menu
¶ Open Maps
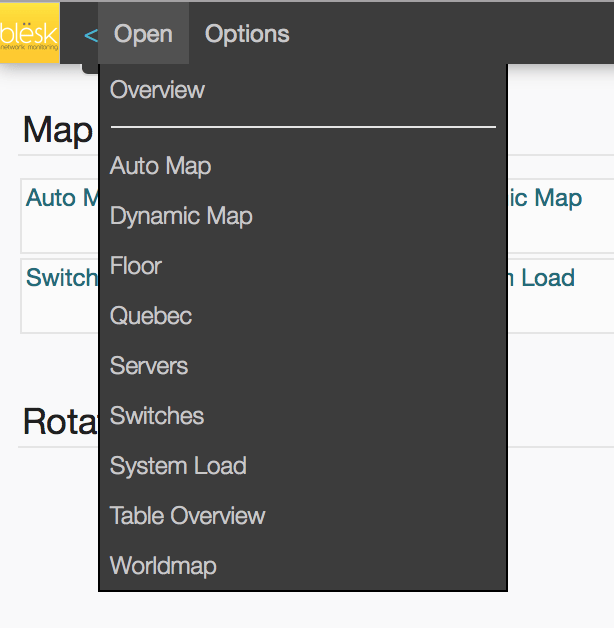
The “Open” tab lists all created and available maps and lets you select one to display. Use this tab to navigate into the software visualization.
¶ View all the available Maps
The overview menu displays all available maps in a dashboard style view. You can also think of it as the top root of the tree. There is a “Rotation Pools” feature available that allows the browser to switch between the maps. The rotation pools feature is configurable in a plain text “ini” style file format located in /usr/share/nagvis/etc/nagvis.ini.php.

¶ Search and modify the selected map
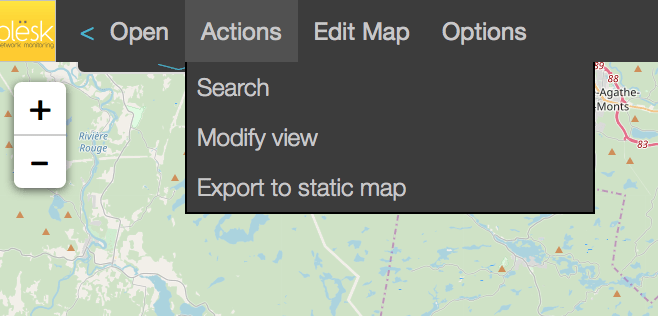
The “Actions” tab contains three menus that let you make a search on the selected map, modify the way a map is displayed or export the Map as is into an image. It is important to note that for the “Actions” tab to appear, you must be on the map on which you want to apply the action.
¶ Modify view
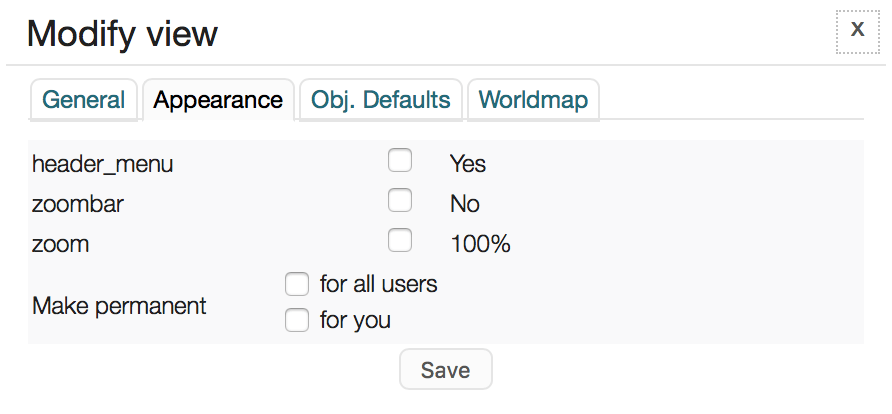
The Modify view menu lets you modify the way the selected map will appear. By default, the changes are not permanent even if you have modified the view, but they can be made permanent as we will see below.
⇣
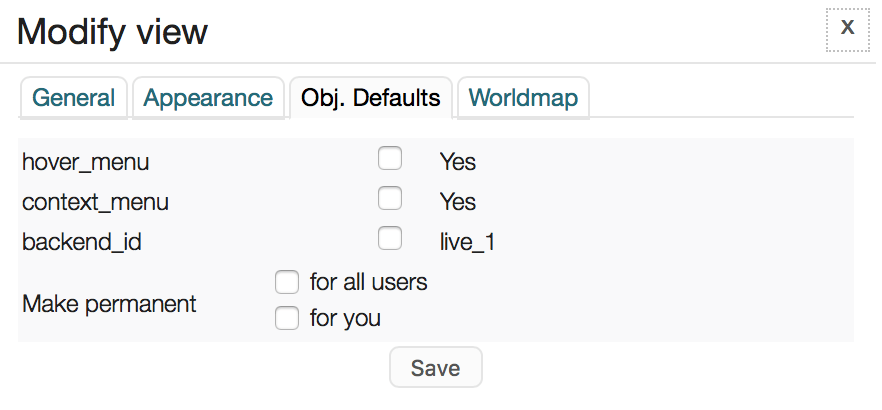
You can change any of the above parameters to modify the appearance of the map. The most important and interesting options are those related to the “header_menu”, “hover_menu”, “context_menu” parameters, and “Make Permanent”.
Here are the explanations of each one:
With the “header_menu” directive, it is possible to hide or display the header menu of the map. By default, the header menu is displayed.
The “hover_menu” directive controls whether to let the user see the hover menu when they put their mouse on an icon on the map. By default, the hover menu is displayed.
The “context_menu” represents the menu that lets you configure features of the element with a right-click of the mouse. By default, the context menu is displayed.
When you make modifications to the default parameters, the modifications are not saved and will revert to the default values when you return to the map. To make the changes permanent, you have to use the “Make Permanent” directive and choose if you want those changes to be permanent “for all users” or just “for you”, then click on the Save button.
¶ Edit Map
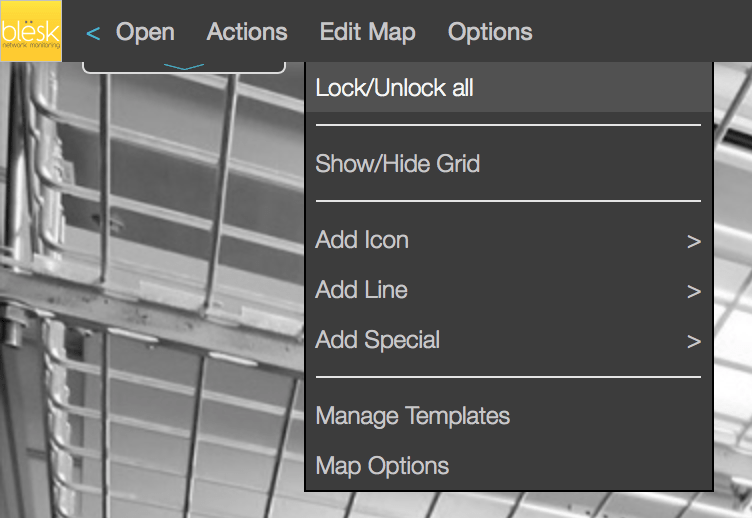
The “Edit Map” tab lets you add different objects to your map (icons, lines, text, etc….). It also provides features that show or hide a grid on your map, letting you easily align your objects, or lock/unlock all your map configurations for quick access to the properties of the different objects.
When you want to make a change to your map, it is always a good idea to “Unlock” all of the maps, in this way you can work on the whole map and without having to remember if an object is locked or not. Remember that to work on a map, the map should be unlocked, and to work on an object, the object should be unlocked. You can avoid complicating your life by unlocking everything before working on the map.
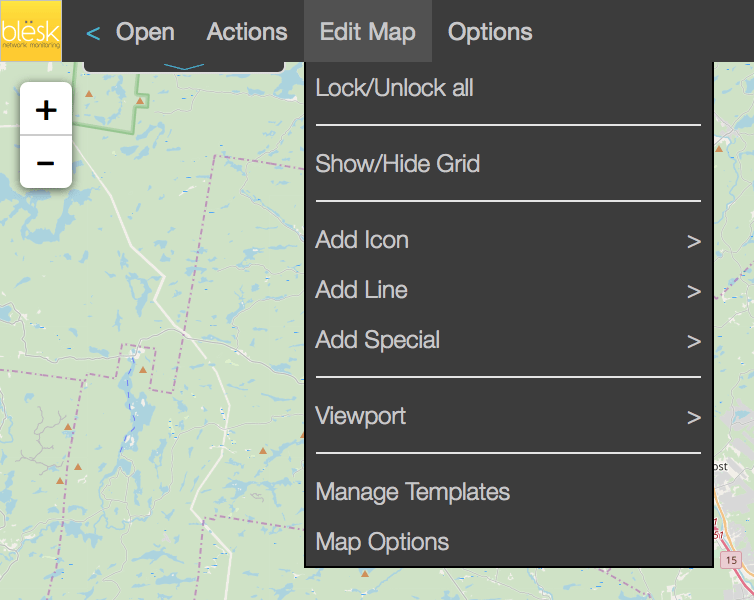
The show/hide feature can be useful when you have many objects and images to position on your map and want everything to be correctly aligned.
¶ Add Icon
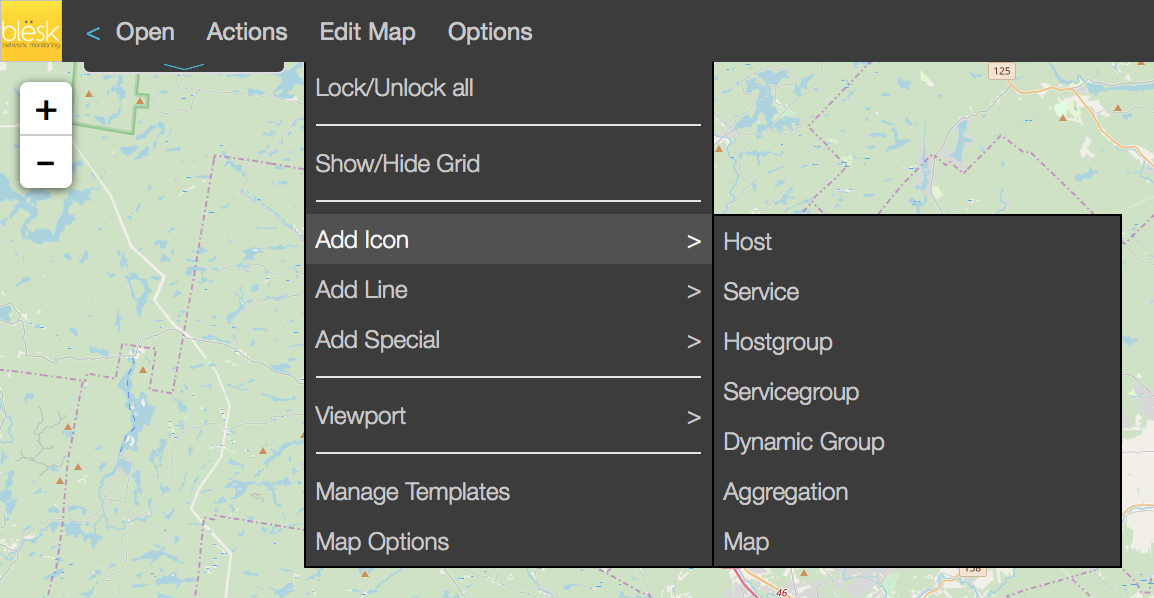
The “Add Icon” option lets you add an icon to represent a host, service, host group, service group, or map. The added icon be used to represent the item on the map, for example, a host icon to represent a host.
If you add an icon to represent a host, then all services that depend on this host will also be represented by the icon on the map. The same applies to the host groups and service groups. If you choose to add a host group, then the hosts that are part of this group will also appear when you position the mouse cursor over the icon representing the host group.
¶ Host
To add an icon to represent a host, go to Edit Map | Add Icon | Host, then from the “host_name” pulldown menu, select the name of the host you wish to add to the map. Leave the other default options as is and click Save. Repeat the steps for any additional hosts that you wish to add to your map.

If you want to get more information about the other available parameters, read here.
¶ Service
To add an icon to represent a service, go to Edit Map | Add Icon | Service, then from the “host_name” pull down menu, select the name of the host from which you wish to select a service. Then from the “service_description” menu, select the name of the service. Leave the other default options as is and click Save. Repeat these steps for any additional services that you wish to add to your map.
It’s important to first select the name of the host, as this will affect the contents of the “service_description” menu to reflect all available services associated with the host.
To get more information about the other available parameters, read here.
¶ Hostgroup
To add an icon representing a host group, go to Edit Map | Add Icon | Hostgroup, then from the ”hostgroup_name” pull down menu select the name of the host group you wish to add to the map. Leave the other default options as is and Save. Repeat the steps for any additional host groups that you would like to add on your map.
To get more information about the other available parameters, read here.
¶ Servicegroup
To add an icon representing a service group, go to Edit Map | Add Icon | Servicegroup, then from the ”servicegroup_name” pull down menu select the name of the service group you wish to add to the map. Leave the other default options as is and click Save. Repeat the steps for any additional service group that you want to add to your map.
To get more information about the other available parameters, read here.
¶ Map
Icon map is different from the other icons in that it allows you to add an icon representing another map in your visualization. Let's say that we have created two maps; map A and B. When working on map A, we can use the Icon map option to add an icon representing map B in our map. In other words, we can create a link from A to B.
To add an icon representing a map, go to Edit Map | Add Icon | Map, then from the ”map_name” pull down menu, select the name of another map you wish to add to the current map. Leave the other default options as and click Save. Repeat the steps for any additional maps that you wish to add to your map.
To get more information about the other available parameters, read here.
¶ Add Line
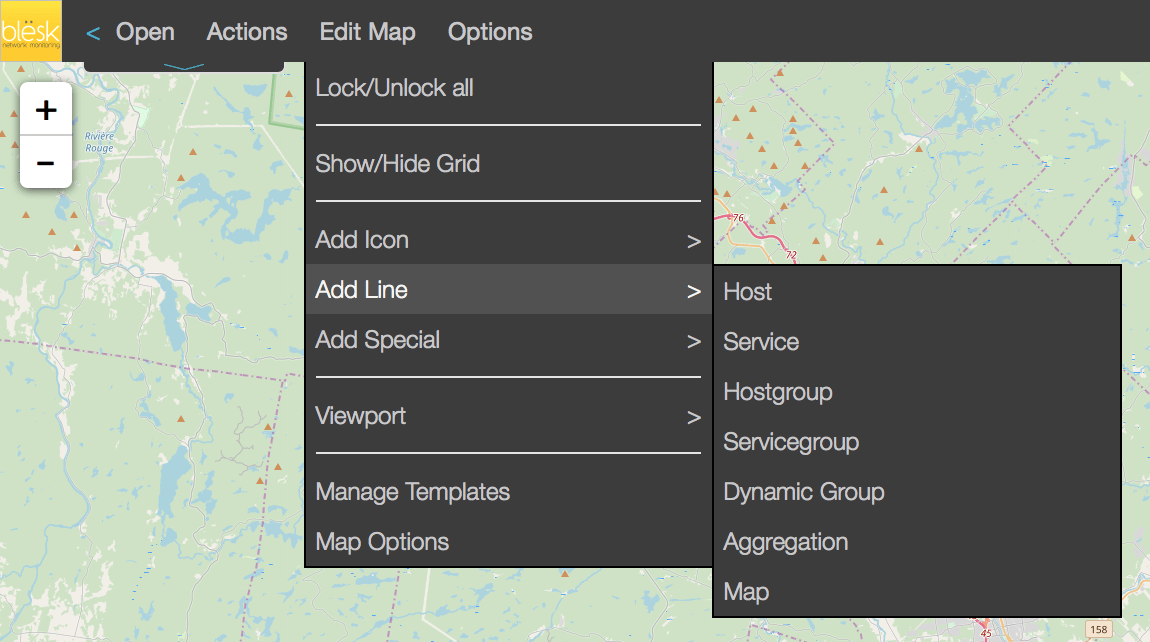
The ”Add Line” option lets you add a line object related to a host, service, host group, service group, or map. The added line object is a printed line between two objects. It can symbolize a connection between two icon objects and be associated with an APM object.
The most frequently used option in this section is “Service”. It can be used to represent a bandwidth consumption stateless line between two connections points, also know as a watermark.
¶ Host
The host line option works the same way as the service line option, however, it is rare that we would need to use it to create a watermark. In order for this to work, the element must generate data or value that can be measured.
¶ Service
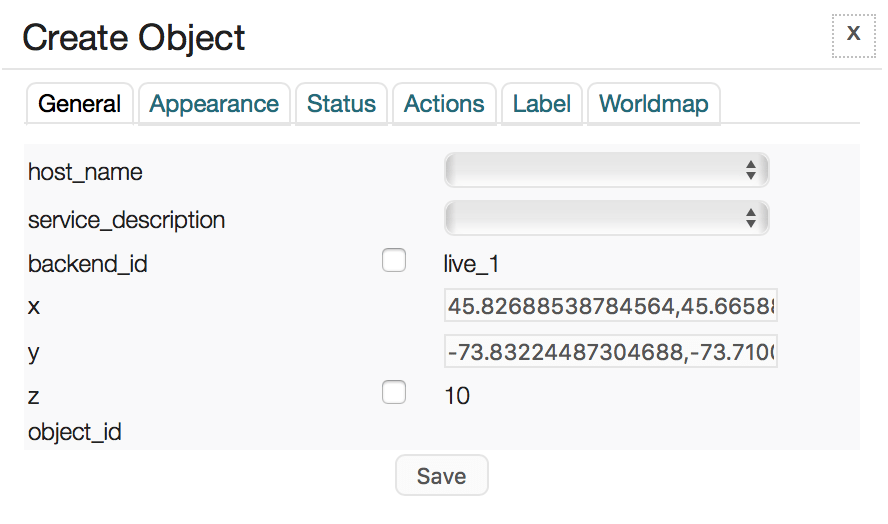
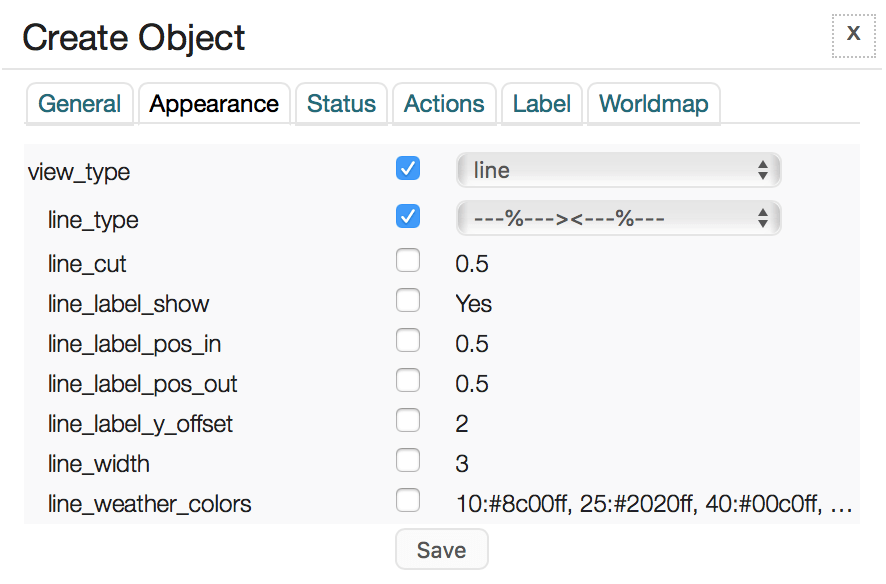
To add a line between two hosts, go to Edit Map | Add Line | Service, then from the ”host_name” pulldown menu select the name of the host you wish to use. Then from the “service_description” pulldown menu select the name of the service. Now click on the Appearance tab, then on “line_type” and select “–%–><–%–” to present the usage in percent format.
Leave the other default options as is and click Save. Repeat the steps for the other endpoint hosts that you wish to add to your map.
Note: Watermark works well with “Service” because service object is often port interfaces or WAN, and this kind of element returns data values.
⇣
To get more information about the other available parameters, read here.
¶ Hostgroup
The hostgroup line option works the same way as the service line option, however, it is rare that we need to use it for creating watermarks. In order for this to work, the element must generate data or values that can be measured.
¶ Servicegroup
The service group line option works the same way as the service line option, however, it is rare that we would need to use it to create a watermark. In order for this to work, the element must generate data or values that can be measured.
¶ Map
The map line option works the same way as the service line option, however, it is rare that we would need to use it to create watermarks. In order for this to work, the element must generate data or values that can be measured.
¶ Add Special
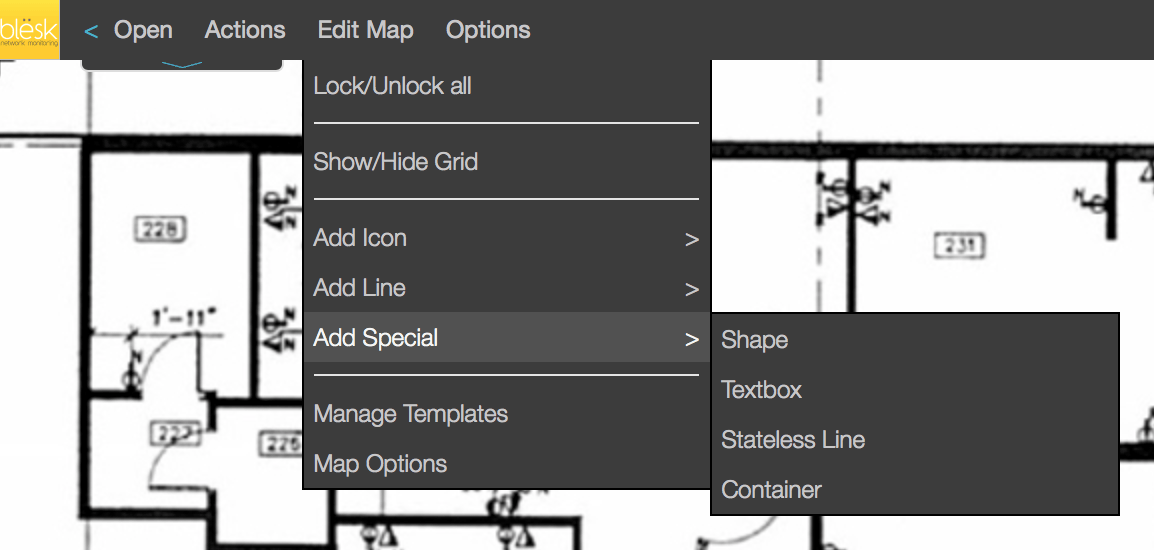
The ”Add Special” option lets you add special objects to your maps such as shapes, text boxes, stateless lines, or containers. These objects provide users the option to create maps that are less static.
¶ Shape
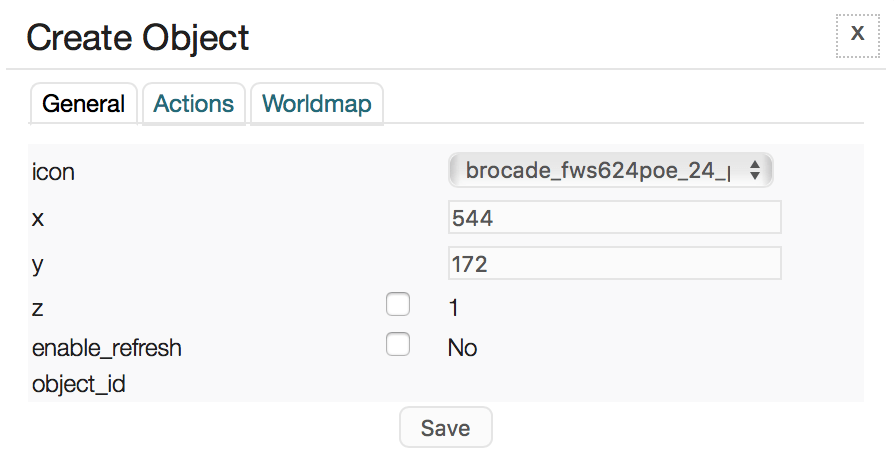
Shapes are basically simple images that can be moved and positioned on the map. Shapes are meant to be layout elements, and allow the users to create maps that are less static.
To add a shape to your map, go to Edit Map | Add Special | Shape, then from the ”icon” pulldown menu select the image you wish to add to the map. Leave the other default options as is and click Save. Repeat the steps for any additional shapes that you wish to add to your map.
To get more information about the other available parameters, read here.
¶ Text box
The text box feature can be used if you would like to add some informational text or titles to your map. Text can be placed anywhere on the map. HTML can also be used for formatting purposes.
To add a text box to your map, go to Edit Map | Add Special | Textbox, then in the ”text” field enter the text you wish to display on the map. Leave the other default options as is and click Save. Repeat these steps for any additional text you wish to add to your map.

To get more information about the other available parameters, read here.
¶ Stateless Line
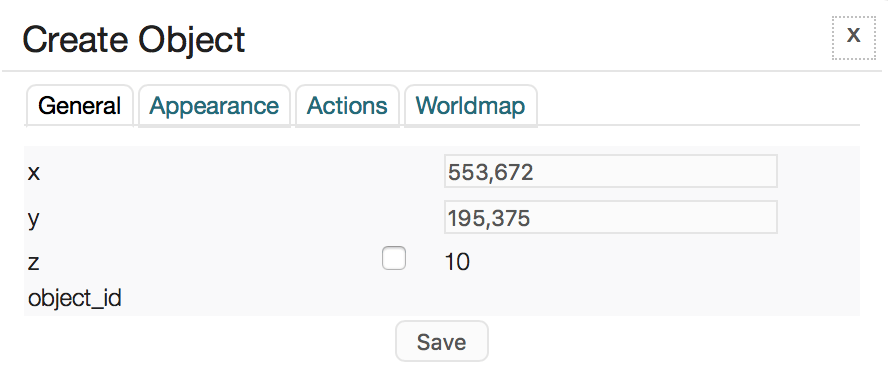
The stateless line feature can be used if you need to connect elements and visualize stateless connections between other objects.
To add a stateless line to your map, go to Edit Map | Add Special | Stateless Line, then move your mouse between the objects you want to join to create the line. Leave the other default options as is and click Save. Repeat the steps for any additional stateless lines that you wish to add to your map.
¶ Container
You can use the container object to display performance graphs generated externally by other programs within APM. It is an advanced and optional feature that can be used to enhance the visuals of your maps.
To add a container to your map, go to Edit Map | Add Special | Container, and select the area of your map where you want to position the container. Next, provide a link in the “url” field that points to the external graph you wish to include in your map. Leave the other default options as is then click Save. Repeat the steps for any additional containers that you wish to add to your map.
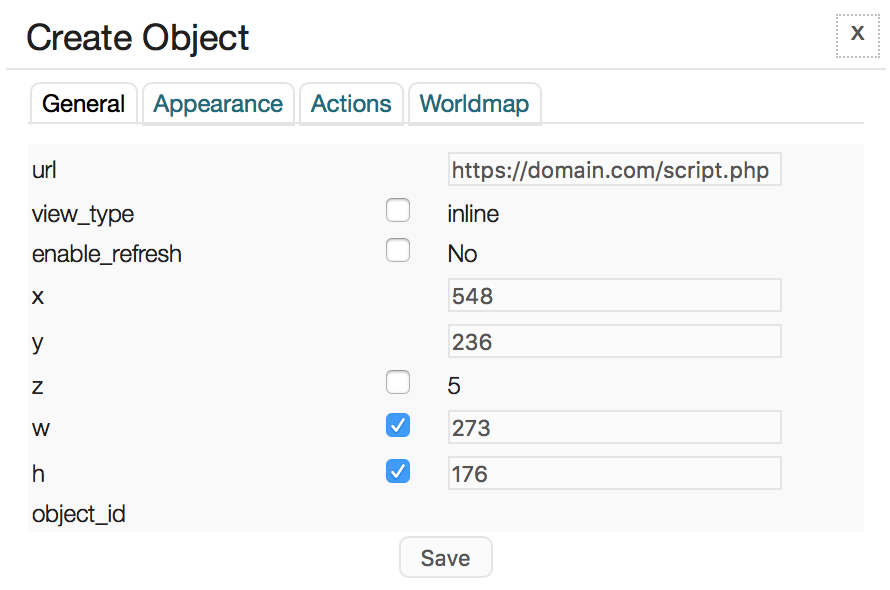
To get more information about the other available parameters, read here.
¶ Map Options
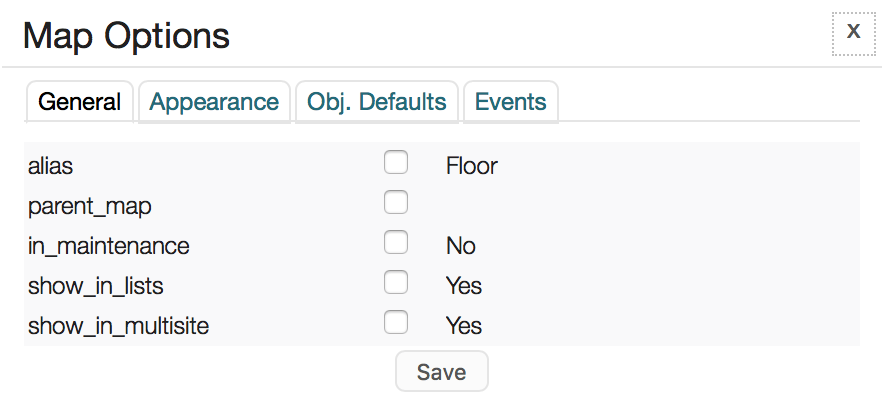
The “Map Options” provide a global view of most of the settings that are already configured and available under the “Edit Map” tab for the selected map. From this menu, you can review or change most of the settings and parameters that have already been defined for the selected map.
¶ Functionalities of the Options menu
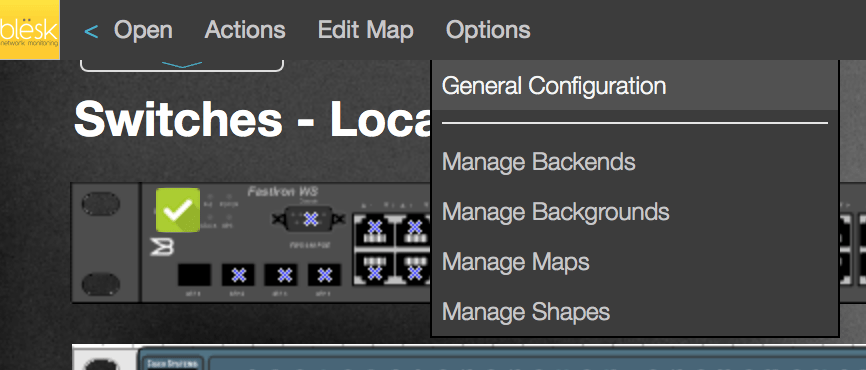
The options tab lets you manage general configuration, backends, backgrounds, maps, and shapes. From this menu, you can change, create, add, rename, or delete parameters. You should avoid playing with the Backends part because it only contains one item already configured by us for you.
¶ Manage Backgrounds
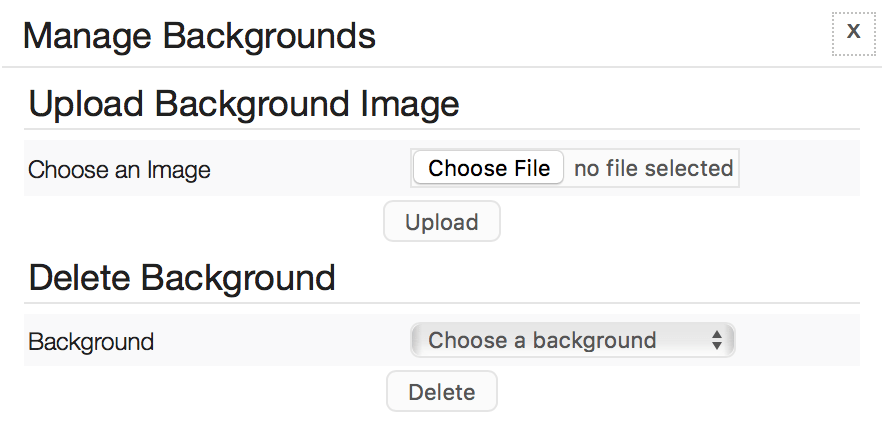
The “Manage Backgrounds” option lets you manage backgrounds images that you wish to integrate into your design. Two actions are available in the manager: upload an image to use as a background, or delete a background.
Note: Creating a background is usually the first step when creating a new map.
Upload an image to use as a background
As a background image, You can use an image that you have created using an image manipulation program or from a Visio chart. To do this, click the Browse button, select your image, and click the Upload button. Images can be in PNG, JPEG, or GIF format.
Delete a background image
To delete a background image, select it from the pulldown menu and click the Delete button. The image will automatically be removed from all the previously created views in which it is used.
¶ Manage Maps
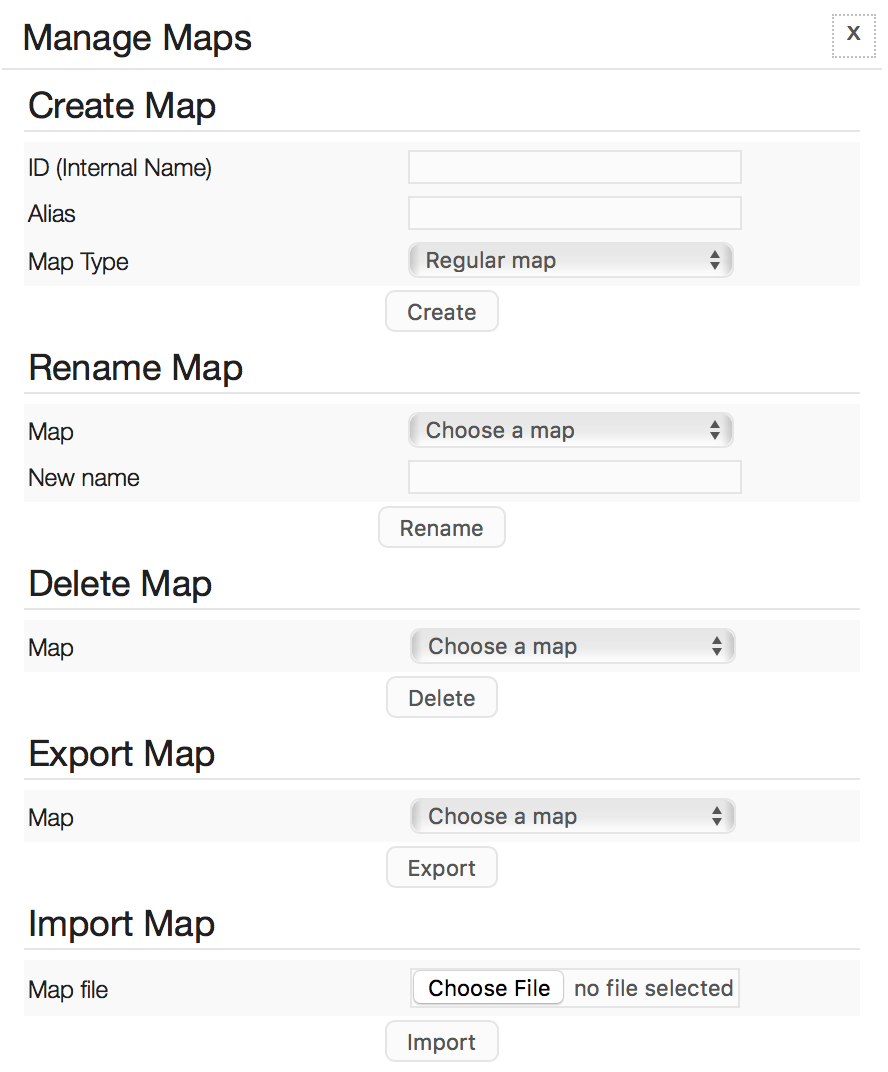
The “Manage Maps” option lets you manage maps. A map represents the canvas on which you will create your graphics. It will later automatically appear in the “Open” tab. Five actions are available in the manager: create, rename, delete, export and import a map.
Create a map
To create a map, you need to give it a name, then an alias. Next, from the “Map Type” pull down menu, select the type of map you want to create. Usually, a regular map will make the job for most of us.
Rename a map
You can rename a map by selecting the name of the map you wish to rename from the “Map” pulldown menu. Then, in the “New name” field provide a new name for the selected map and click the Rename button. This will only affect the map name, and not any titles within the map that may have the same name.
Delete a map
To delete a map, select it from the “Map” pulldown menu and click the Delete button. Maps that have been deleted cannot be retrieved.
Export or Import a map
Exporting a map means exporting its configuration file, and Import is for importing a configuration file. You may need to export a map configuration to create a backup, or to import it into another system.
¶ Manage Shapes
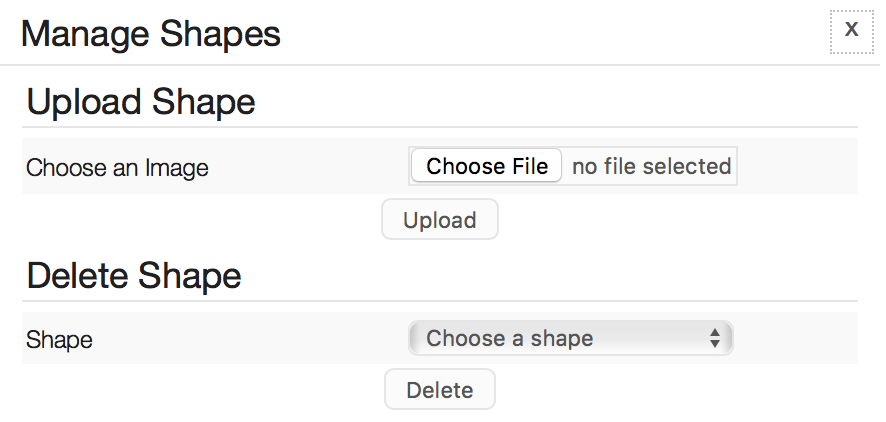
The “Manage Shapes” option lets you manage shapes. A shape can be any image representing a device or other element that can be moved and positioned on your map. The shapes are meant to be layout elements. The shapes were added to give the users the option to create less static maps. Two actions are available in the manager: upload or delete a shape (image).
Upload a shape
To upload a shape click the Choose File button, then choose your image. The uploaded image will be added to the library and will be available to be used during the creation of your map.
Delete a shape
To delete a shape, select the name of the image from the “Choose a shape” pulldown menu and click the Delete button.
¶ Functionalities of User menu
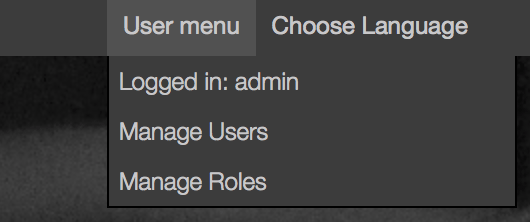
The User menu tab lets you change existing users' passwords, and manage users and roles. It is from within this tab that you can fine tune the login process and which map views are allowed for specific users. From this tab, you can control what users can view and which actions they can perform on a map.
¶ Manage Users
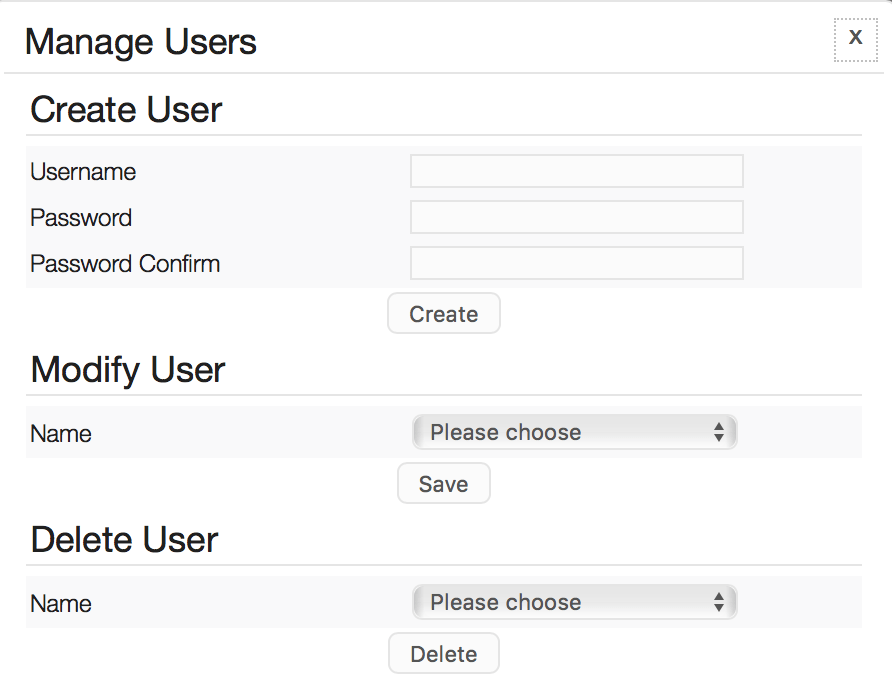
Using the “Manage Users” option you can create, modify or delete users. All users that you create here can only access the Network Map section (this plugin) of APM.
Create User
To create a new user, enter the username and password in the field, then click the Create User button.
Modify Users
You can modify the role of a user by selecting the username from the “Name” pulldown menu, and then choosing from the “Available Roles” box the type of permission you wish to assign to this user. From the “Selected Roles” box, you can also select the type of permission you wish to remove for this user. Remember that roles are created in the “Manage Roles” menu.
Delete User
Select the user you wish to delete from the “Name” pulldown menu, then click the Delete button.
¶ Manage Roles
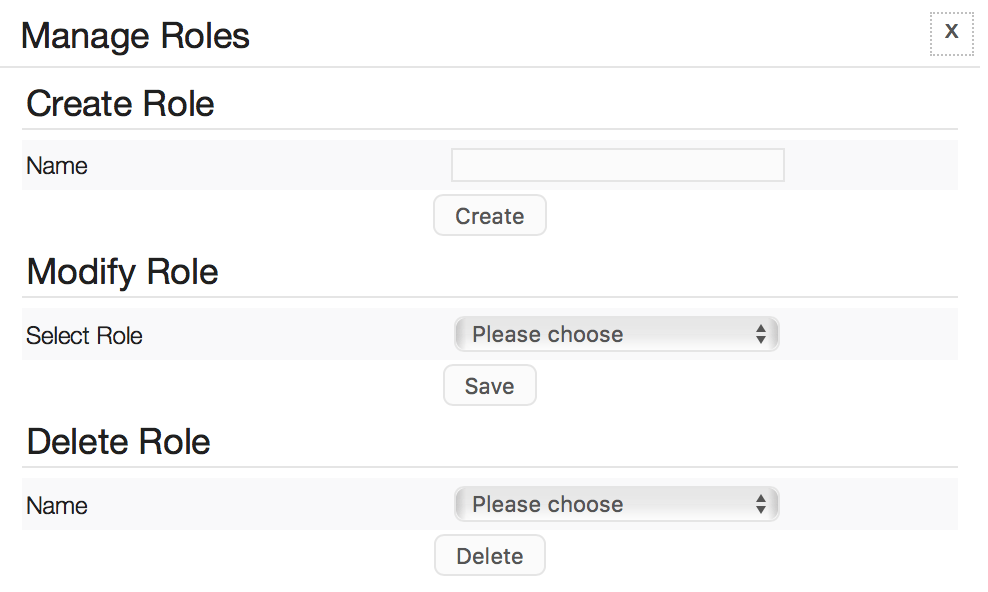
With the “Manage Roles” option you can create, modify, or delete roles. All roles that you create here, will only apply to the Network Map section (this plugin) of APM.
Create Role
To create a new role, enter its name in the “Name” field and then click the Create button. This will create the new role and add it to the list of available roles.
Modify Role
The “Modify Role” directive lets you modify or set permissions of existing and new roles. Select the role name that you wish to work with from the “Select Role” pulldown menu. Next, set the allowed permissions for each “module”, the related “action” and click the Save button.
Delete Role
To delete a role, select the role from the “Name” pulldown menu and click the Delete button.
¶ Get started with the demo maps
As you have seen there are a couple of demo maps in the default configuration. They are included so you have something to start with when you are using NagVis for the first time.
¶ Change default sound
How to change the default sound of different states at the frontend
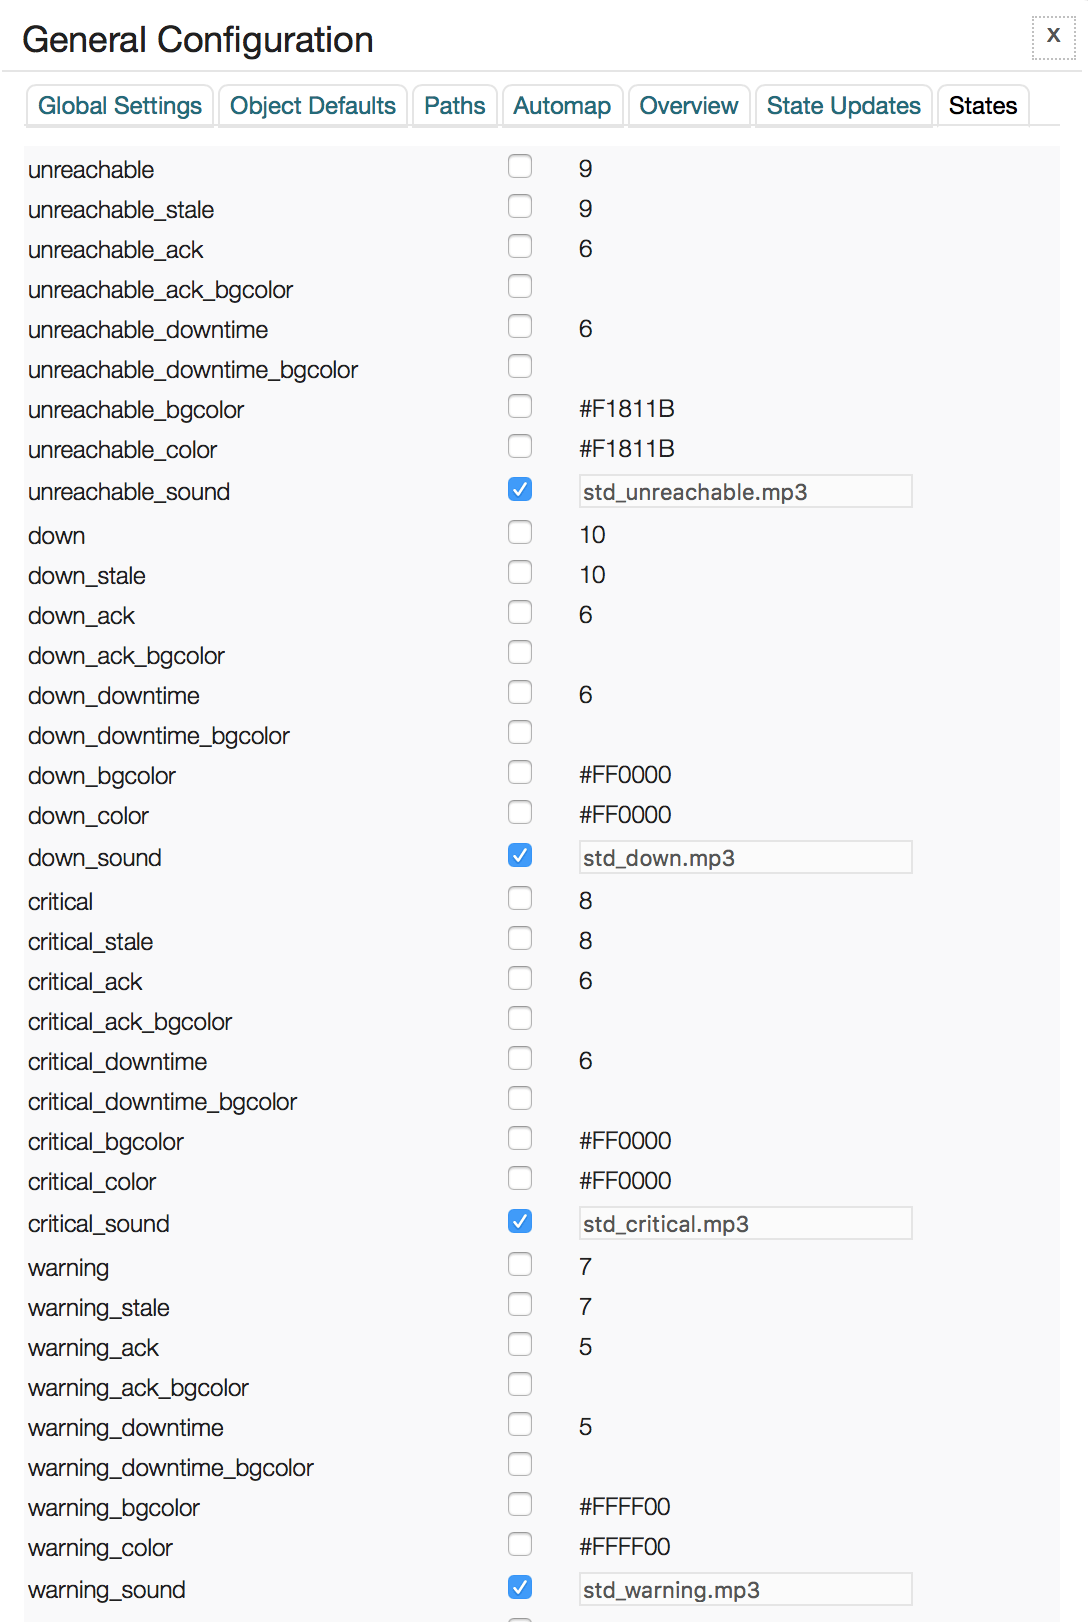
There are four different states on which you can associate a sound. Those are when the host or service is unreachable, down, critical or warning. The sound file is being played on changes to the mentioned state and needs to be in MP3 format.
Here are the steps to change the default sounds:
- Upload your MP3 sound files into the blësk server. The location on the blësk server to upload a new sound file in MP3 format is “/usr/share/nagvis/share/userfiles/sounds“. Be sure that the file permission is owned by the Apache process. You can use SCP, WinSCP or a similar SSH tool to upload on the server.
- Once the sound file is under the correct directory, you must go to the General Configuration to select it. Go to Options | General Configuration.

- Then under the “States” tab, check the box near the sound file name you want to change, and enter the new name, then click
Save.
¶ Create a drill down
How to drill down to another map from an object on a map
Sometimes, we need to have a map representing an overview of some or all other maps. In this way, if something goes wrong with the other objects monitored on the additional maps, we can see it from the root view and drill down to it.
Here are the steps to do it:
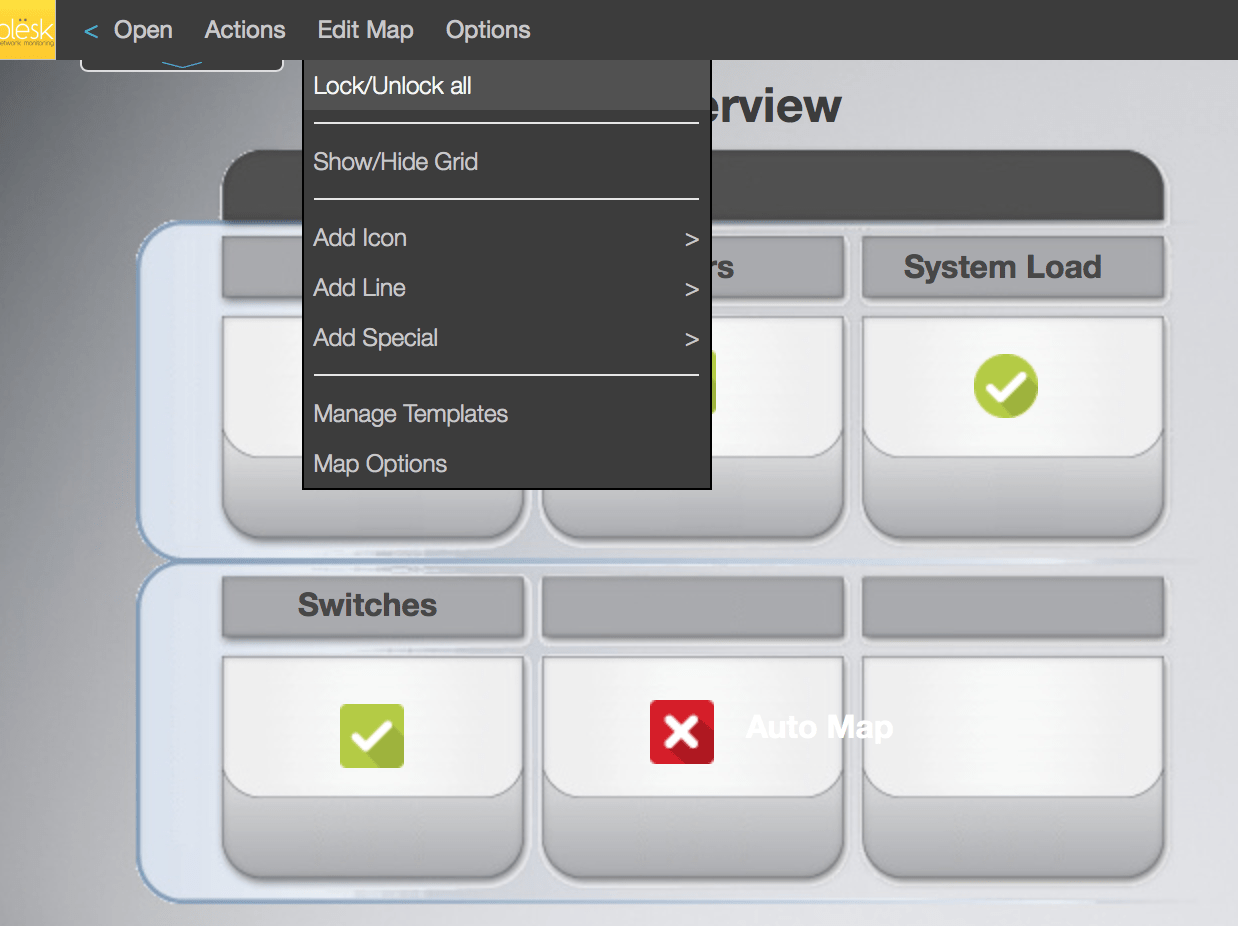
- Go on a map from which you want to provide this feature. Click on Edit Map | Lock/Unlock all to switch in global edition mode.
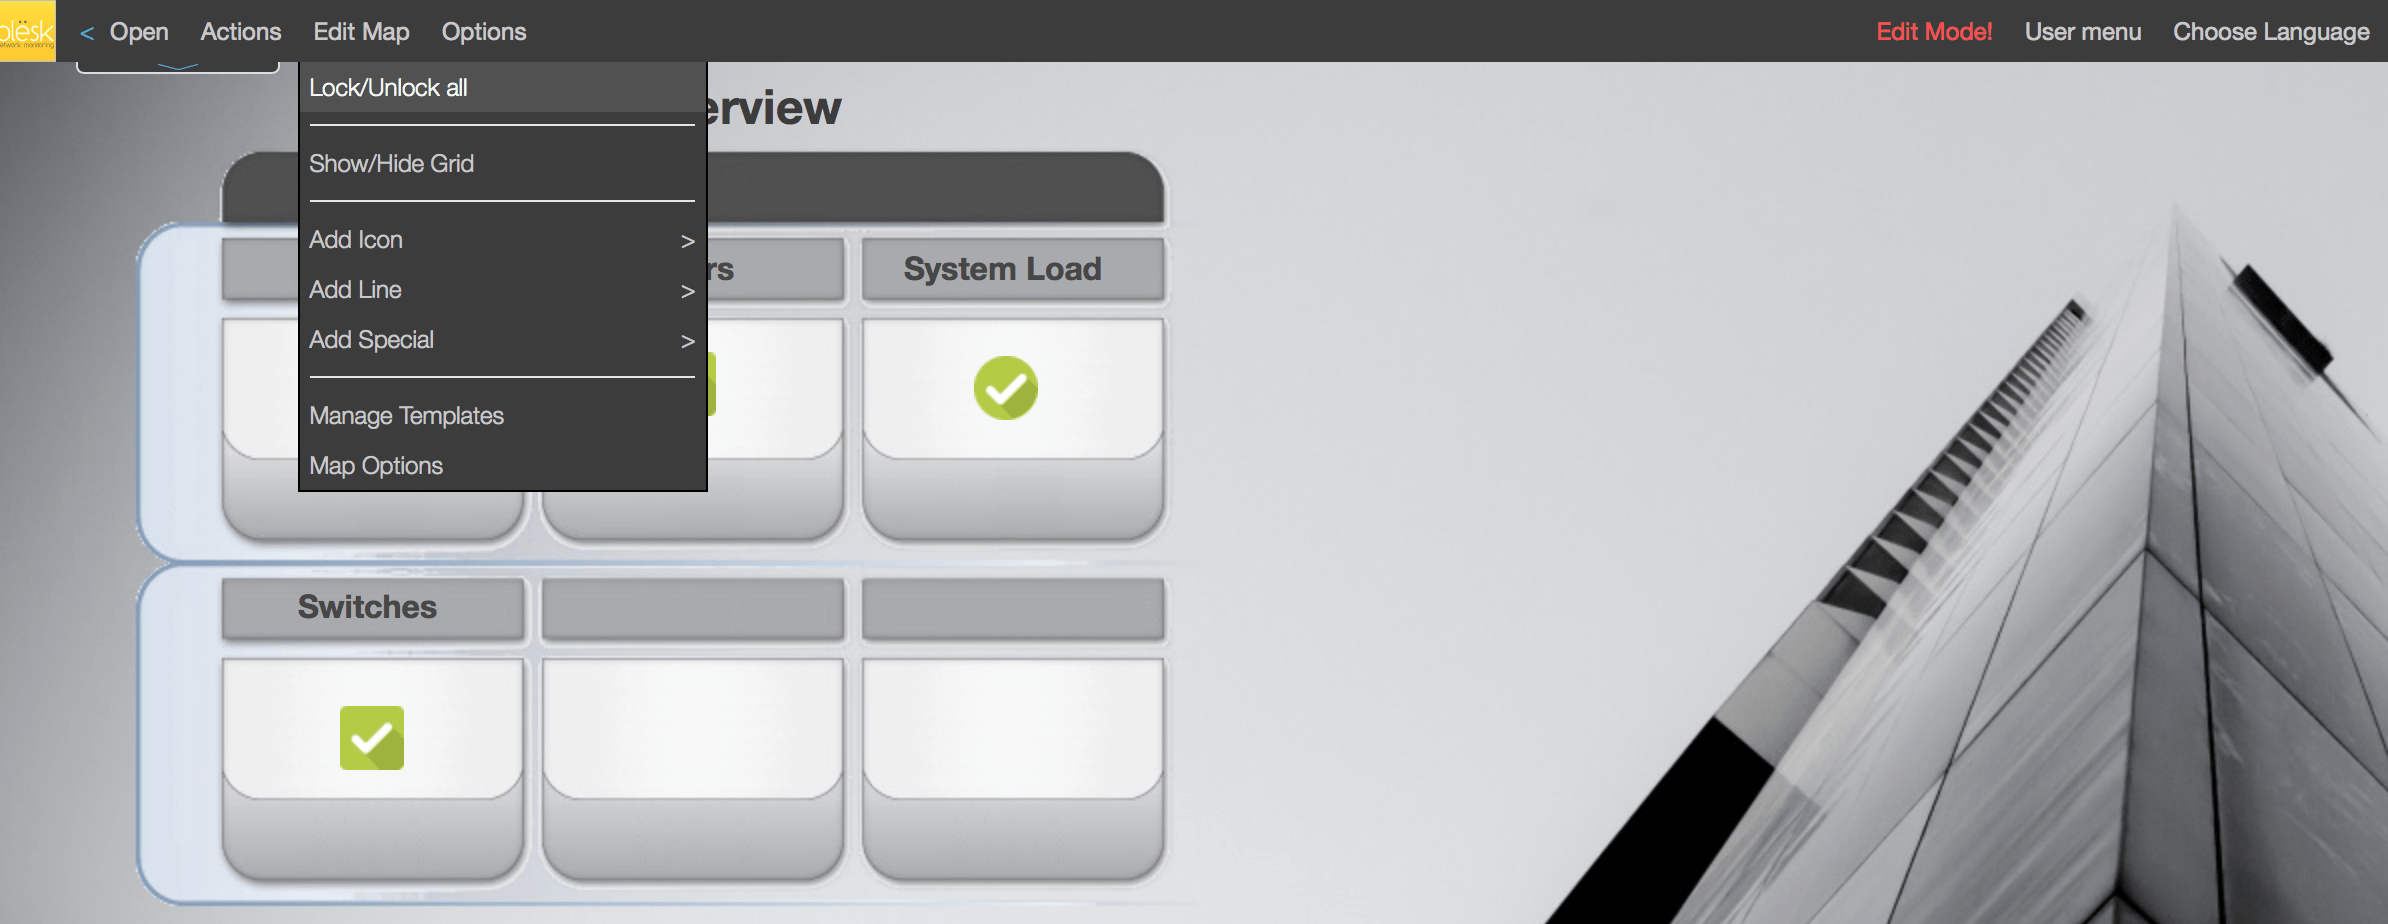
- Now, go under Add Icon | Map and click on it.
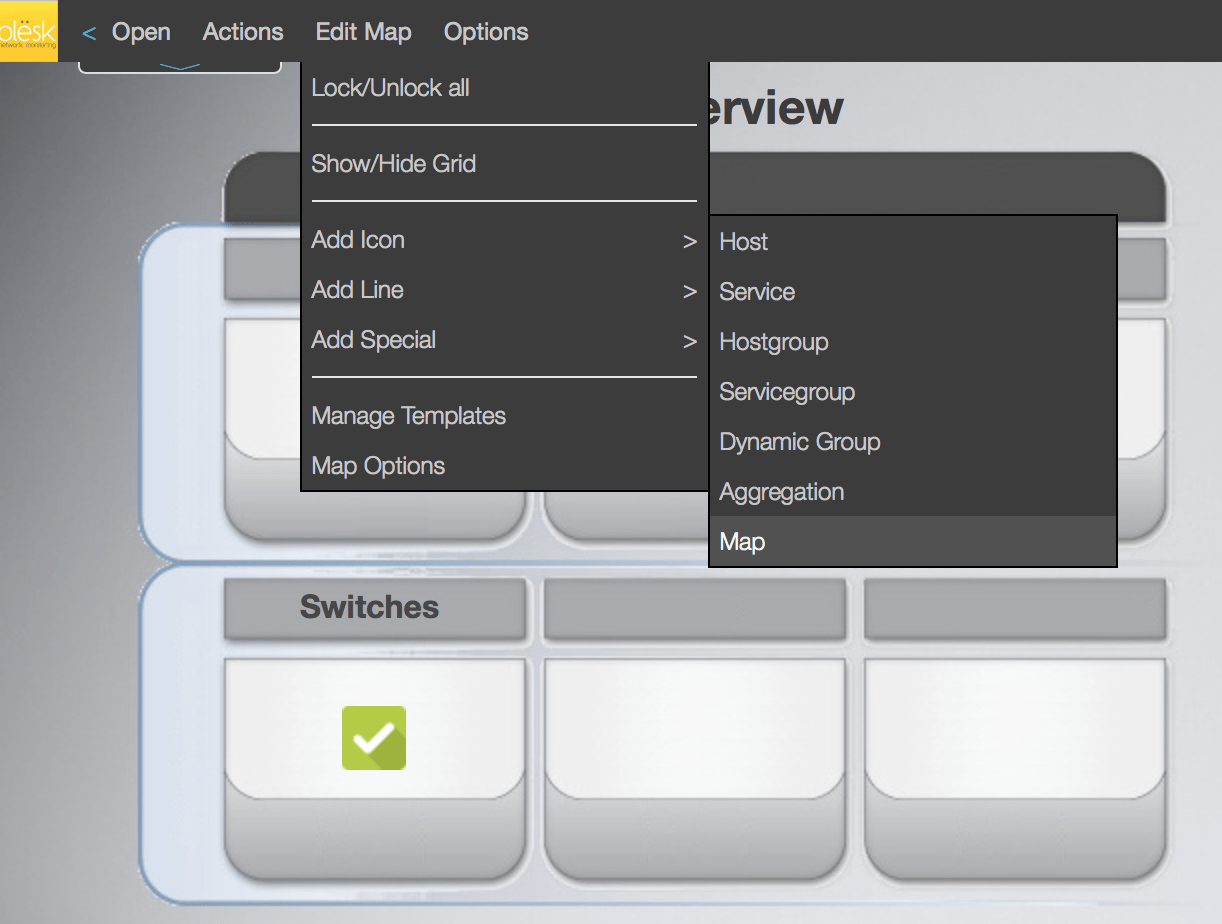
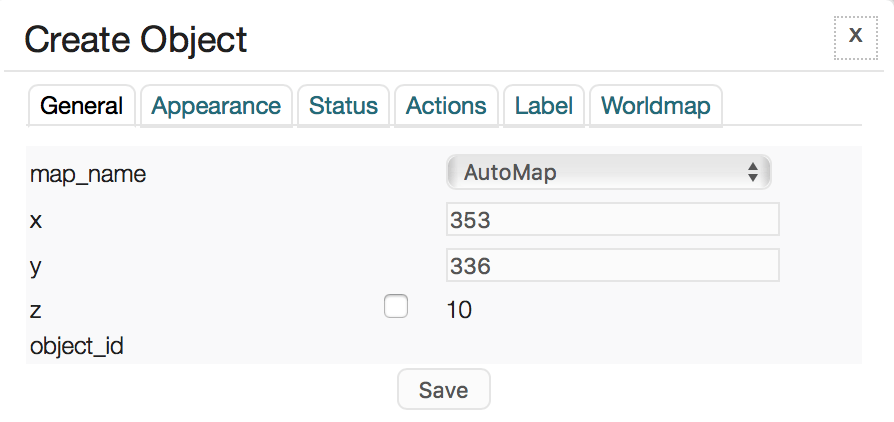
- Click on your map area where you want to position the new Map icon and under the pulldown menu called “map_name“, select the map you want to drill down to and click on the
Savebutton.
- Finally, go back on Edit Map | Lock/Unlock all to switch off global edition mode.
¶ Fit background size
How to have a background that automatically fit different screens
When using an image as a background for your map, it could become difficult to have an image that fit all kind of screen resolution. Here is a way to make your background image fit all king of screens.
We’ll use the stylesheet approach to do it. Create a CSS file containing the following information under the “/usr/share/nagvis/share/userfiles/styles” directory and call it background.css. Be sure that the permission of the file is owned by the apache user.
body {
    background-image: url(/images/wallpaper-1920x1080.jpg);
    background-repeat: no-repeat;
    background-size: auto;
}
The above code indicates the use of the image called wallpaper-1920×1080.jpg as a background to automatically fit the screen used.
Note You can use tools like WinSCP or SCP to transfer the CSS file to the blësk server.
- Transfert the wallpaper-1920×1080.jpg image to the blësk server under the “/var/www/html/images/” directory. This is the only place where your background image should be. Be sure that the permission of the file is owned by the apache user.
Note: You can use tools like WinSCP or SCP to transfer the image to the blësk server.
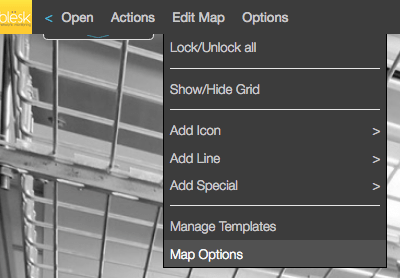
- Go to Edit Map | Map Options of your map
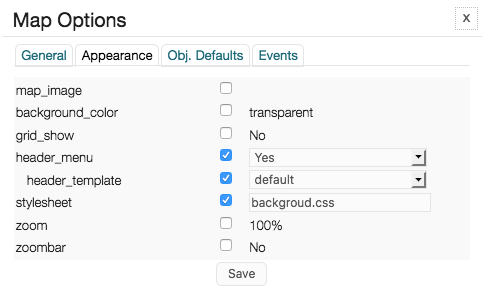
- Click on the ‘Appearance‘ tab and be sure that the “map_image” option is unchecked, then check the “stylesheet” options, write the name of your CSS file here and click
Save. In our example, we’ll use the background.css file we have created previously.
¶ Move multiple items together
How to move multiple icons representing host together
Sometimes, you need to move your icons to realign on the map and moving one icon at a time is not a solution. Here is a way to use shortcut keys to move multiple items together.
- Go on your map, then Edit Map | Lock/Unlock all to unlock your map.
- Once the map is unlocked, press
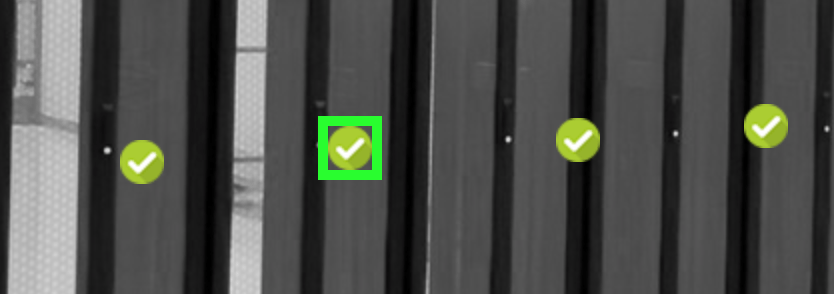
CTRLon the icon you want to move. A green rectangle will appear on the next icon, click on it, and repeat for each icon you want to include in the group for realignment. Once you’ve clicked on each one, move them with your mouse to the new location on the map.
Note: Press CTRL for relative positioning. Hold CTRL till drop for absolute positioning.
Note: Press SHIFT for relative positioning. Hold SHIFT till drop for absolute positioning.
¶ References
You will find below links pointing to external references for this function of the software. These links will allow you to retrace more advanced information on the subject.