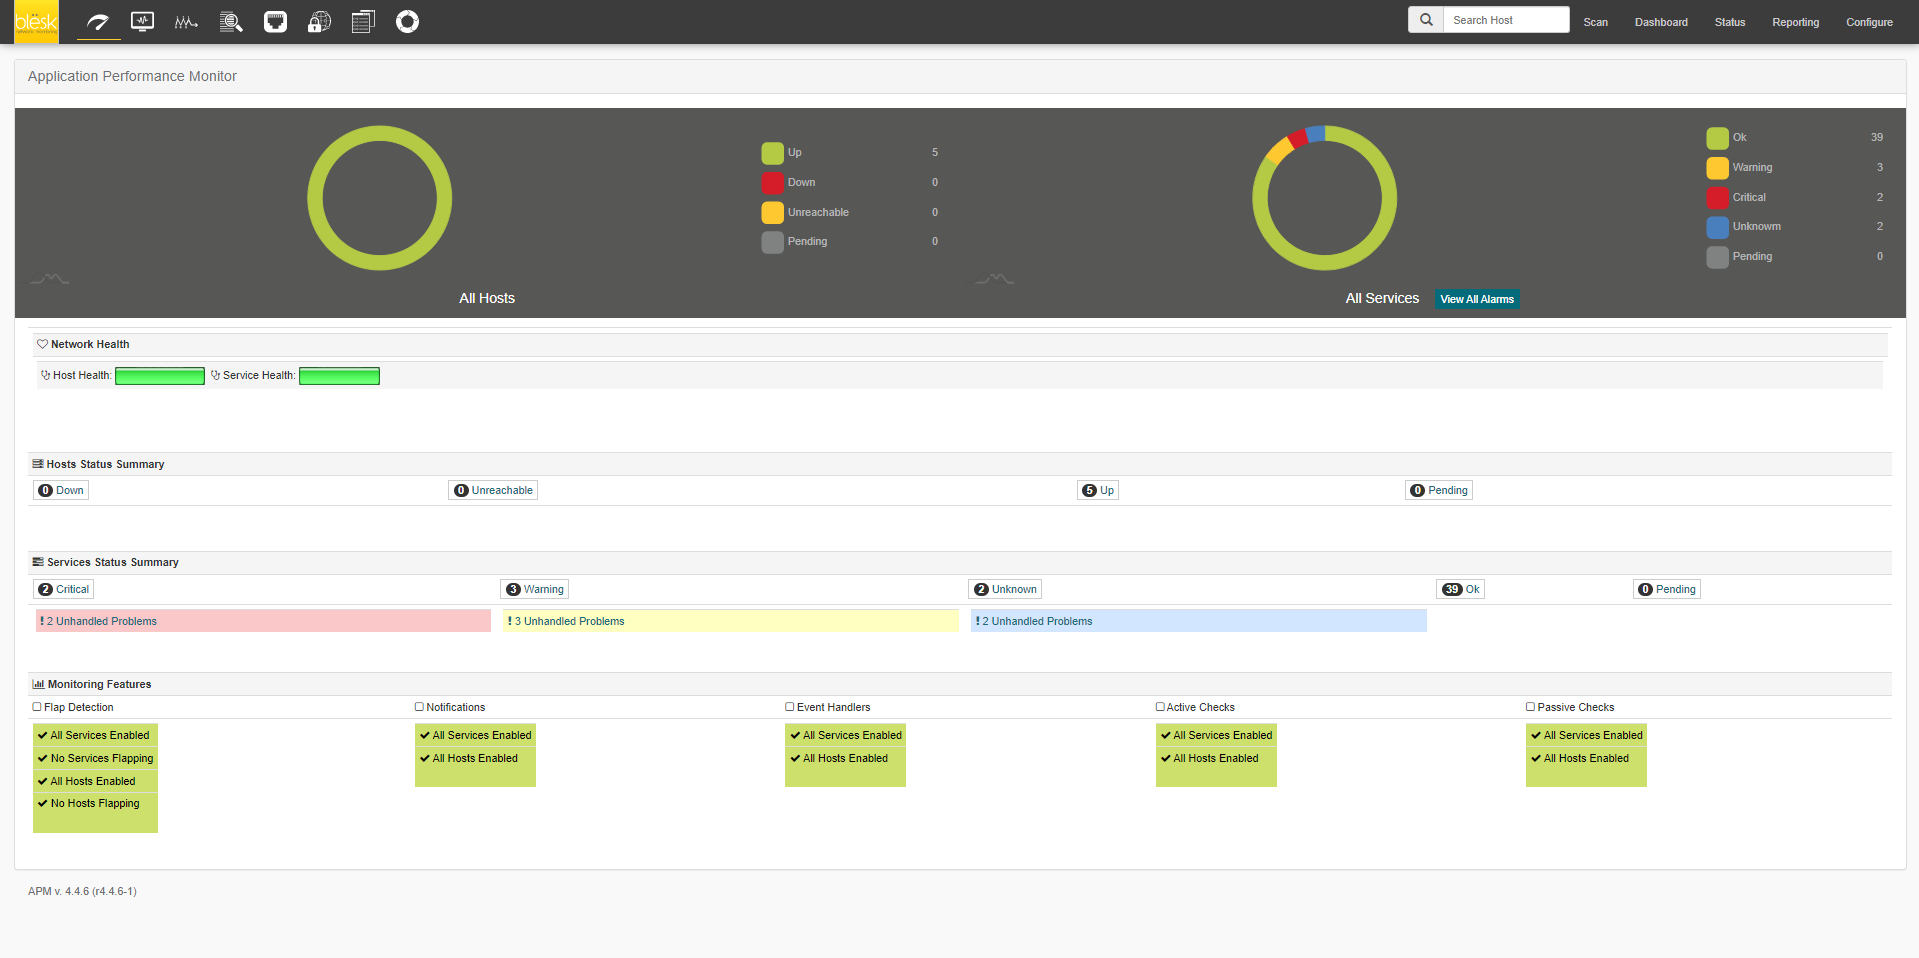
¶ Introduction
blësk Application Performance Monitor (APM) is used for monitoring servers and applications running within an IT environment. Effective implementation of blësk APM allows your organization to quickly detect application, service, or process problems, and take action to eliminate downtime for your application users. blësk APM provides tools for monitoring of applications and application state – including Windows applications, Linux applications, UNIX applications, and Web applications. blësk APM offers the flexibility to monitor your servers with both agent-based and agentless monitoring.
The main purpose of this module is to monitor and control the services on servers, client machines, hosts or physical devices.
By “service monitoring”, we mean that if a service running on a system crashes, becomes unresponsive, etc, then an alert is generated and displayed in the “Application Performance Monitor” section of blësk. An alert is also sent by e-mail to the specified administrator(s).
See the Quick Start guide for examples of the monitoring and control of the services with APM.

By default, the services on the management console (the blësk server) are already monitored. In fact, you can find out immediately if blësk is working properly or not. It can also serve as a good example of how to use the available features.
The tools (Tabs) available with “Application Performance Monitor” are as follows and appear in the top part of your interface.

For an easy way to add hosts to be monitored, see the Network Device Discovery.
There is also a video tutorial available here.