¶ Introduction
The Reporting menu contains a series of reports about your hosts & services and the alerts, events, and notifications that have been generated on your APM server.
These include reports detailing the availability of your hosts, services, host groups, and service groups. There are also reports demonstrating state trending, and alerts generated by your host and services.

¶ Trends
Use Trends to create personalized reports based on different criteria that apply to Hosts or Services monitored by APM.
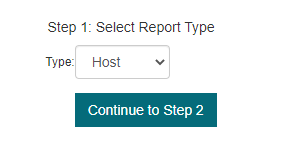
Step 1 – Choose between Host or Service.
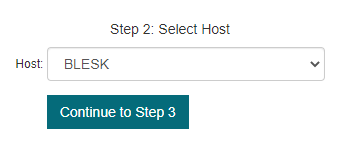
Step 2 – Select the host or service that interests you (the one for which you would like to create or view a report).
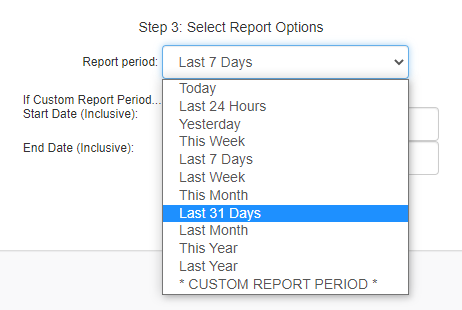
Step 3 – Select the desired time period then click “Create Report”.
The diagram that appears shows you the state of the host or service you have chosen. In a “Trends” report, there are four conditions on which the report is based: “Ok”, “Warning”, “Unknown” and “Critical”.
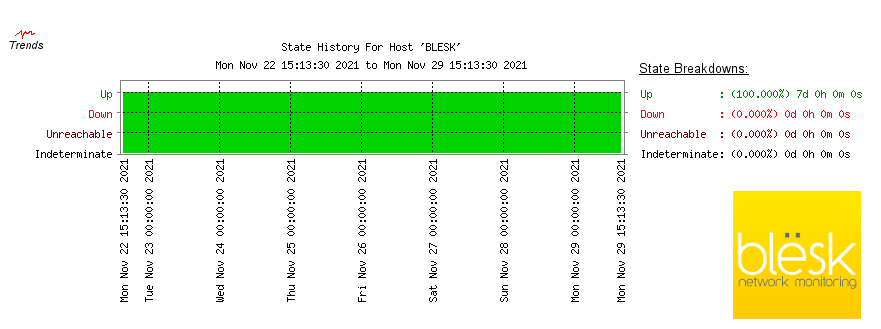
You also have the ability to zoom in on the report by clicking the time period range of your choice.
¶ Availability
Availability Management is a process of Service Delivery (ITIL specifications). Its goal is to ensure that the required level of availability is provided. The measurement and monitoring of IT availability is a key activity to ensure availability levels are being met consistently.
Availability Management should look continuously to optimize the availability of the IT infrastructure and its services. Here's how to create an availability report:
Step 1 – Choose between host, host group, service, or service group:
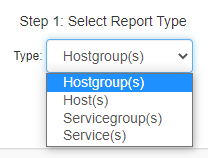
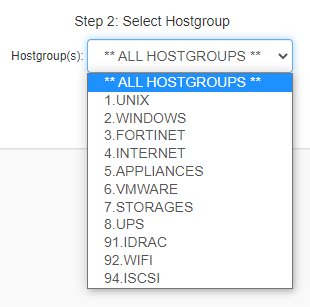
Step 2 – Select from the list:
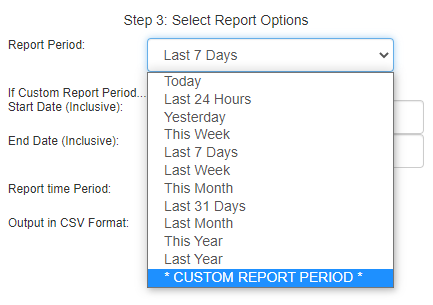
Step 3 – Select the desired period:
You will end up looking at a report showing your selected hosts and four status percentage columns:
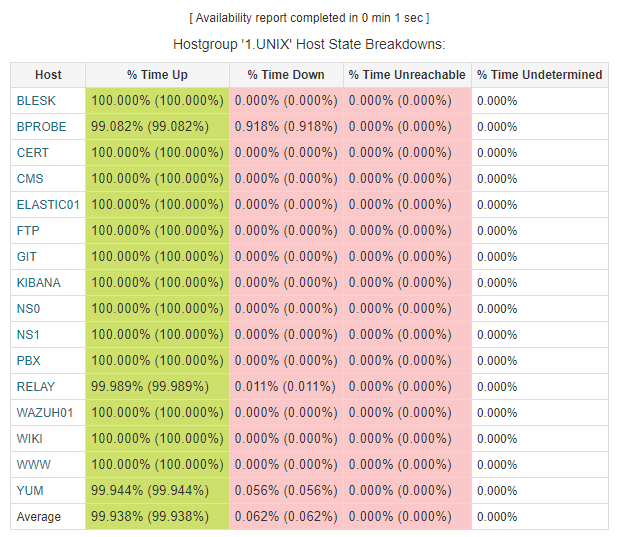
Below is a description of the columns:
Host - The name of the host as it appears in APM
% Time Up - How much of the time the host was actually up (this is the standard availability value)
% Time Down - How much the host was actually down
% Time Unreachable - How much time the host was unreachable (different from “Down” in that this could be caused by a network outage resulting in the host not being reachable due to unavailability of its parent hosts, but not actually being down itself).
% Time Undetermined - Percentage of time in which APM did not have complete log data on the device and; thus, cannot provide uptime statistics for that timeframe. This can happen with newly added devices, for example.
Time Undetermined and Numbers in Brackets
Also with regards to the “% Time Undetermined” column, you will notice that APM shows two values for each of the other metrics, one “normal” and one in brackets - 86.200% (86.200%). If the “% Time Undetermined” is zero, then these two numbers will always match, however, should you have any instances where APM did not have log data available for the specified time period, you will see it reflected in the other columns. So for example, with recently added devices, the number in brackets will show the actual system uptime, while the “normal” number will assume that the device was simply down. In a situation like this, the number you want to show to your boss is the one in brackets.
¶ Alert Summary
This page provides some generic reports about host and service alert data, including alert totals, top alert producers, etc.
Here is the main screen:
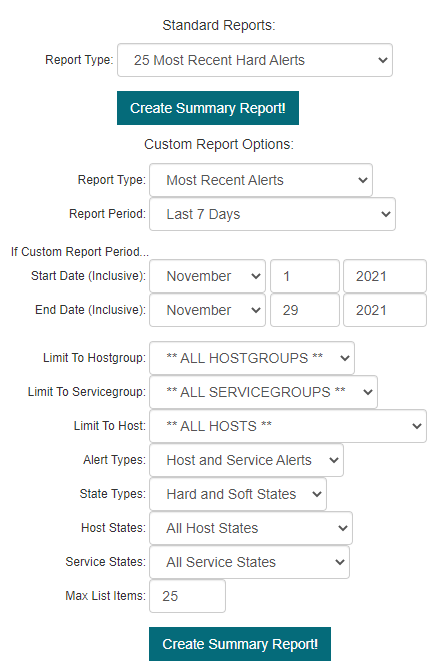
At the top you have the « Standard Reports »:

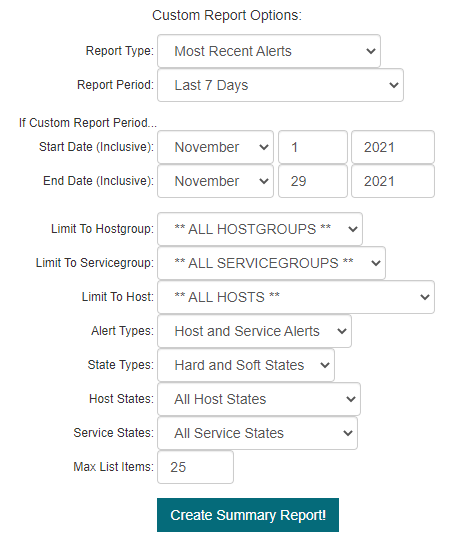
If you wish to perform specific searches, use the settings called « Custom Report Options »
¶ Notifications
This section displays host and service notifications that have been sent to various contacts. You have the ability to filter the output to display only the specific types of notifications you wish to see (i.e. service notifications, host notifications, notifications sent to specific contacts, etc).
In the event that an alert was not received, this can be useful for validating whether it was sent or not.
