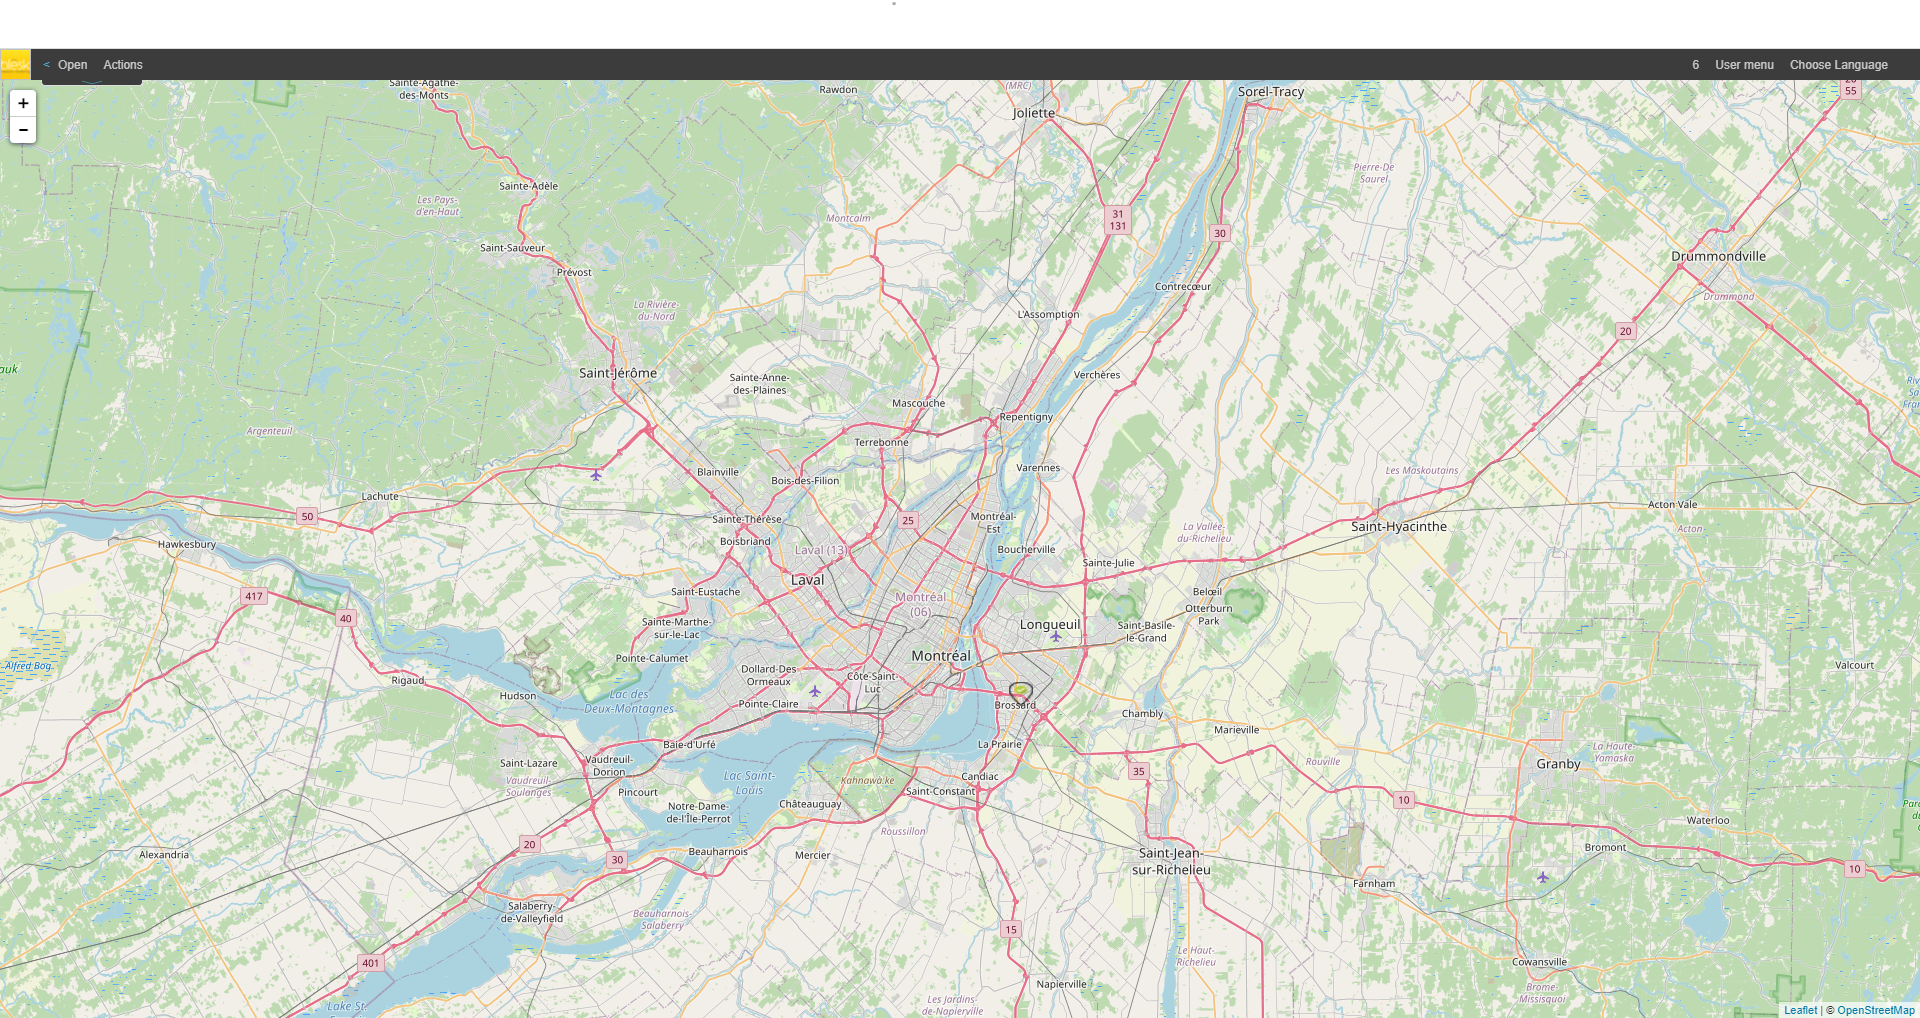
The Status Tab is one of the most important tabs in APM. From this tab, you can view quick information on the health of all of your monitored hosts and services. It allows to access various types of information and visualize the status of devices in easy to read tables and grids.
From this tab, you can also access other important features of APM, which allow you to do such things as view SNMP Traps (discussed below) received from devices on your network, or design network maps using ”Network Map”.
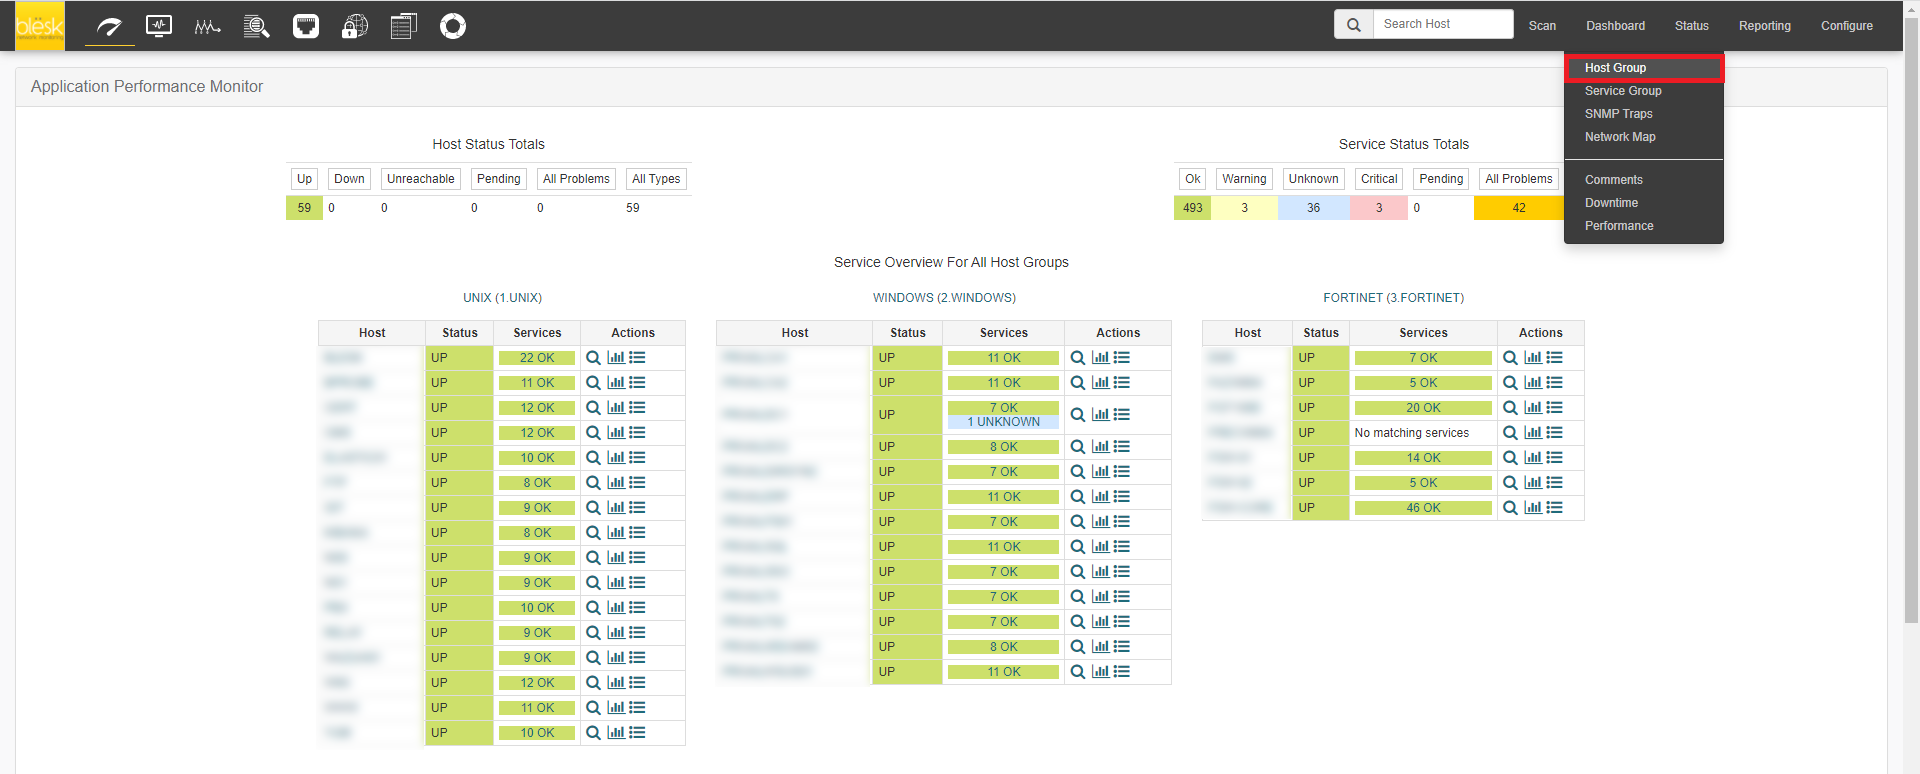
¶ Host Group
The Host Group menu item provides a global view of all the hosts, displayed by group. Here you can view the state of each host, the number of services running and the status of each service. In the “Actions” column you can manage your hosts, view detailed statistics of their activities, or consult their operating states.
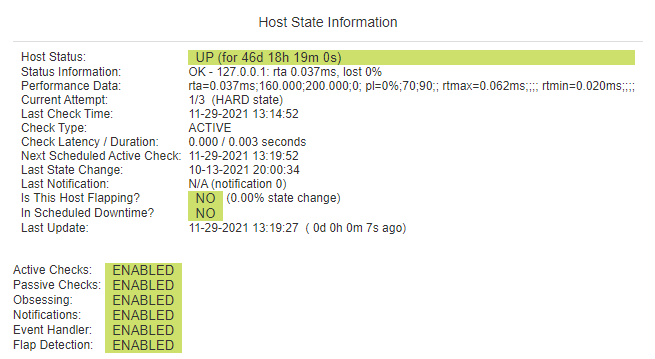
If you click on the “Magnifying glass” icon a new page for the host in question appears, providing further information on the selected host.
The commands available may vary depending on the state or the type of service. Here is a list of the most commonly used commands:
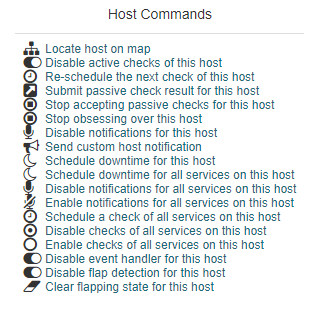
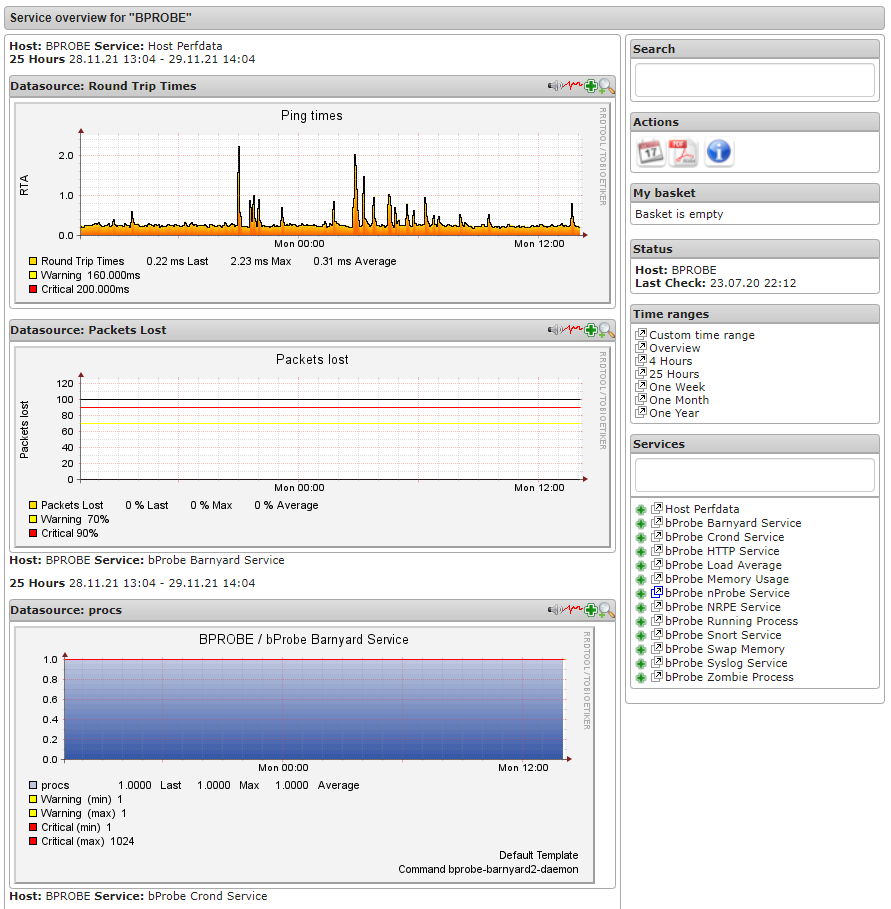
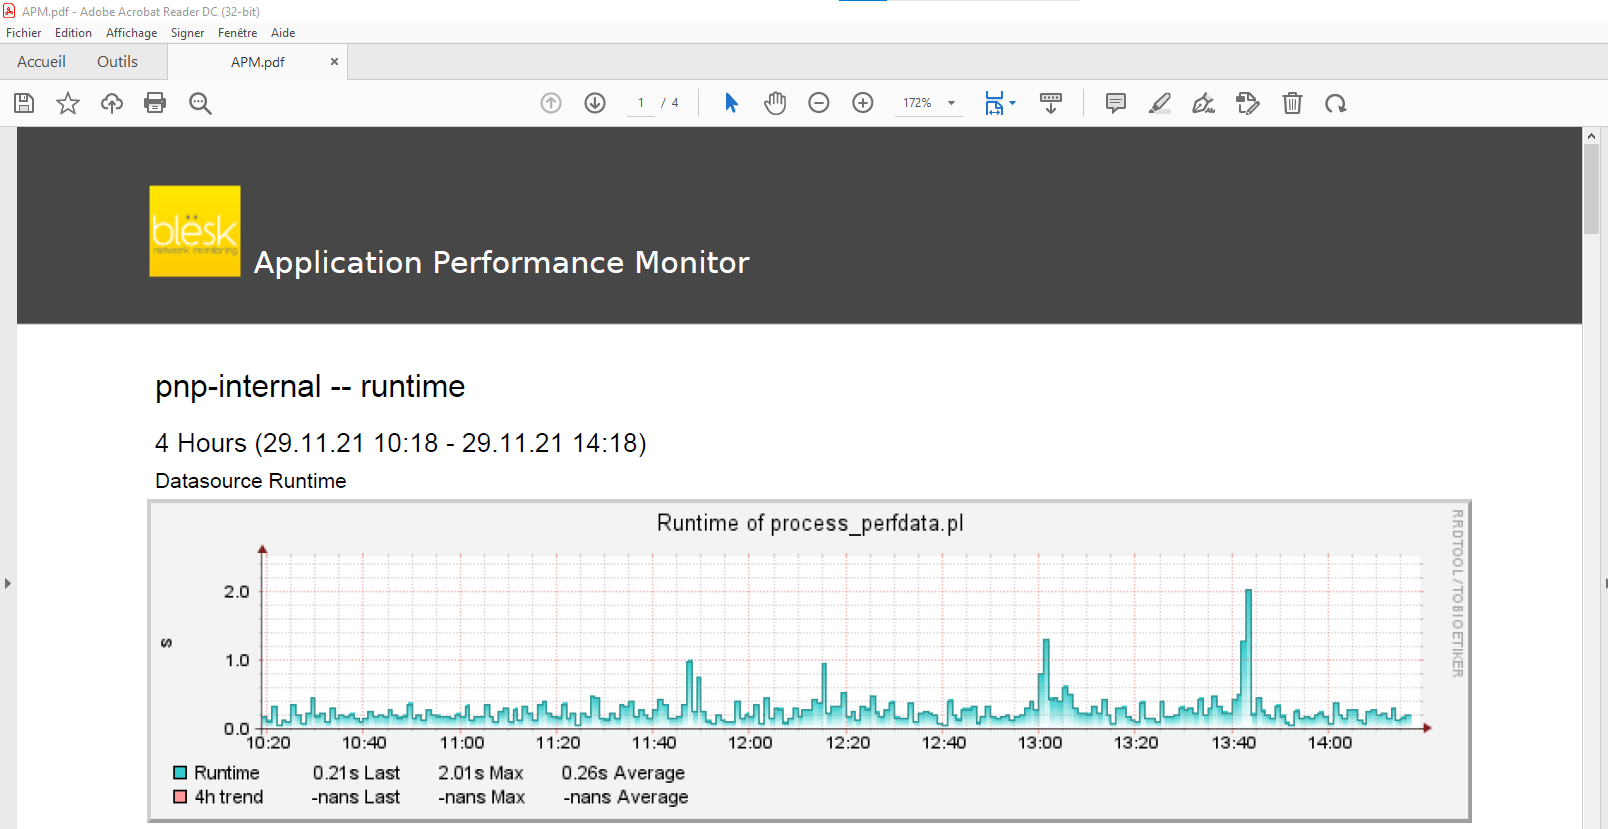
Chart icon next to the service opens a new page where you will find several diagrams related to the host services.
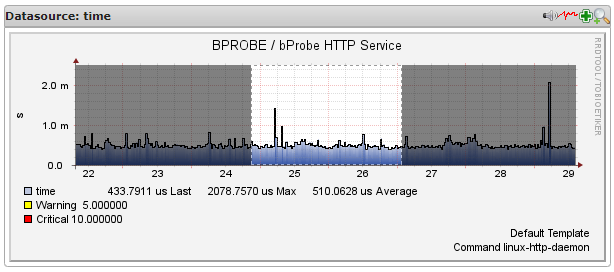
You can manipulate each chart with the mouse, selecting (zooming into) the time period that interests you.
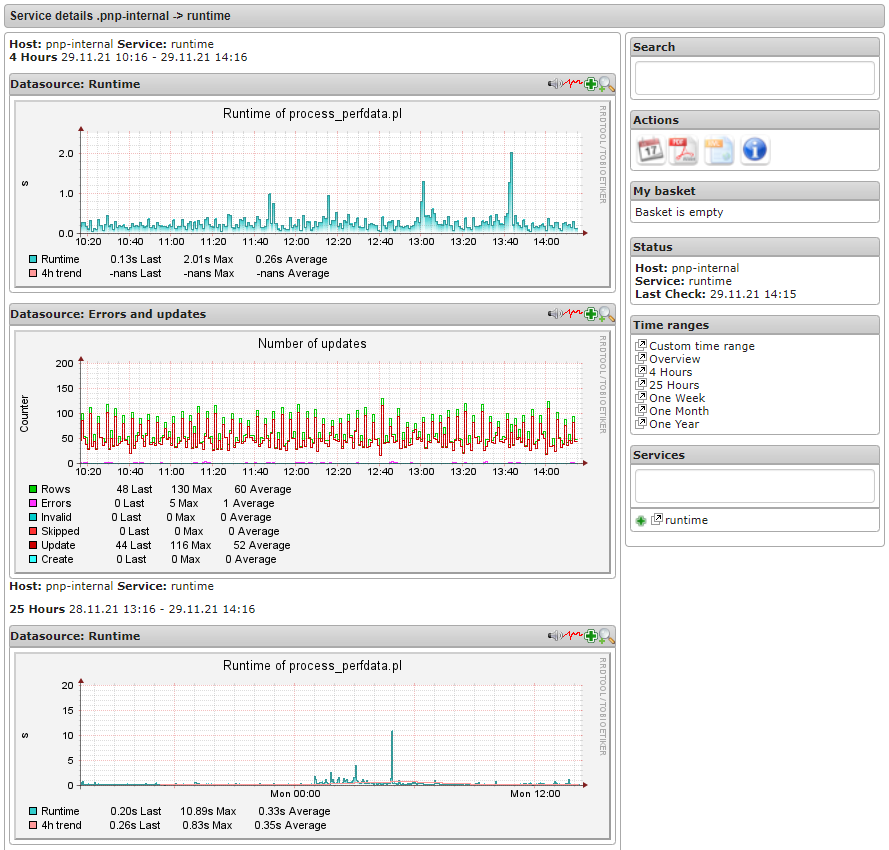
Several options are available on the right side of the page. The information menu provides access to the internal statistics of the engine generating these graphs.
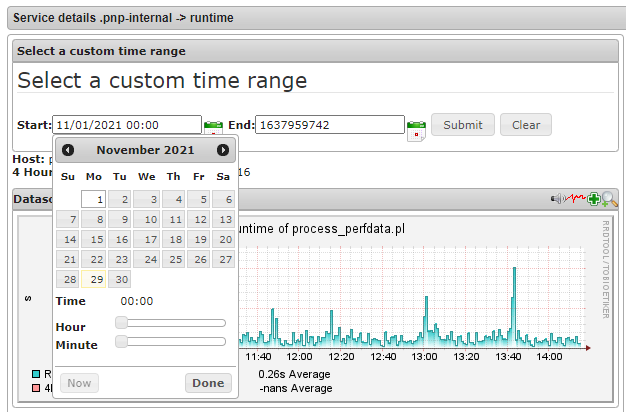
If you click on the calendar, you will see a menu allowing you to target a time frame in which you want to view the performance data collected by APM.
You also have the option to export the desired information to a PDF file.
¶ Service Group
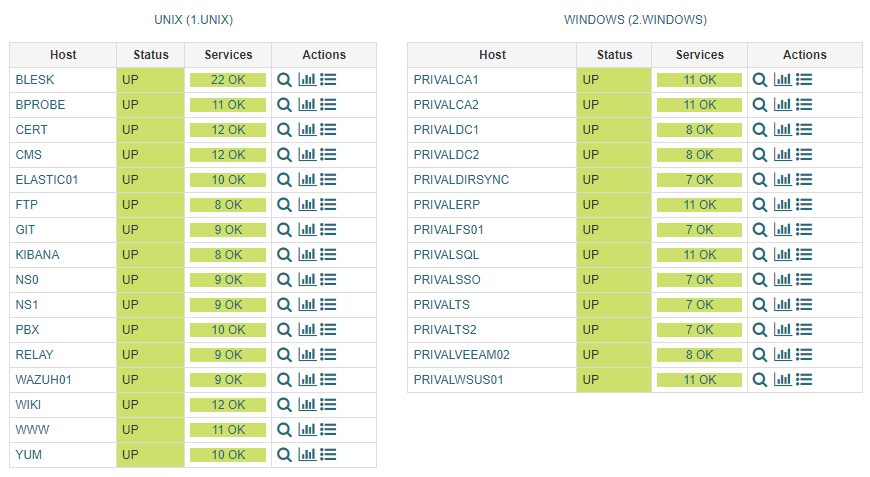
Service Groups are groups of one or more services. Service groups can make it easier to view the status of related services in the web interface. Below is an example of hosts sorted by (previously created) service groups, showing the number of services in each group and their health.
¶ SNMP Traps
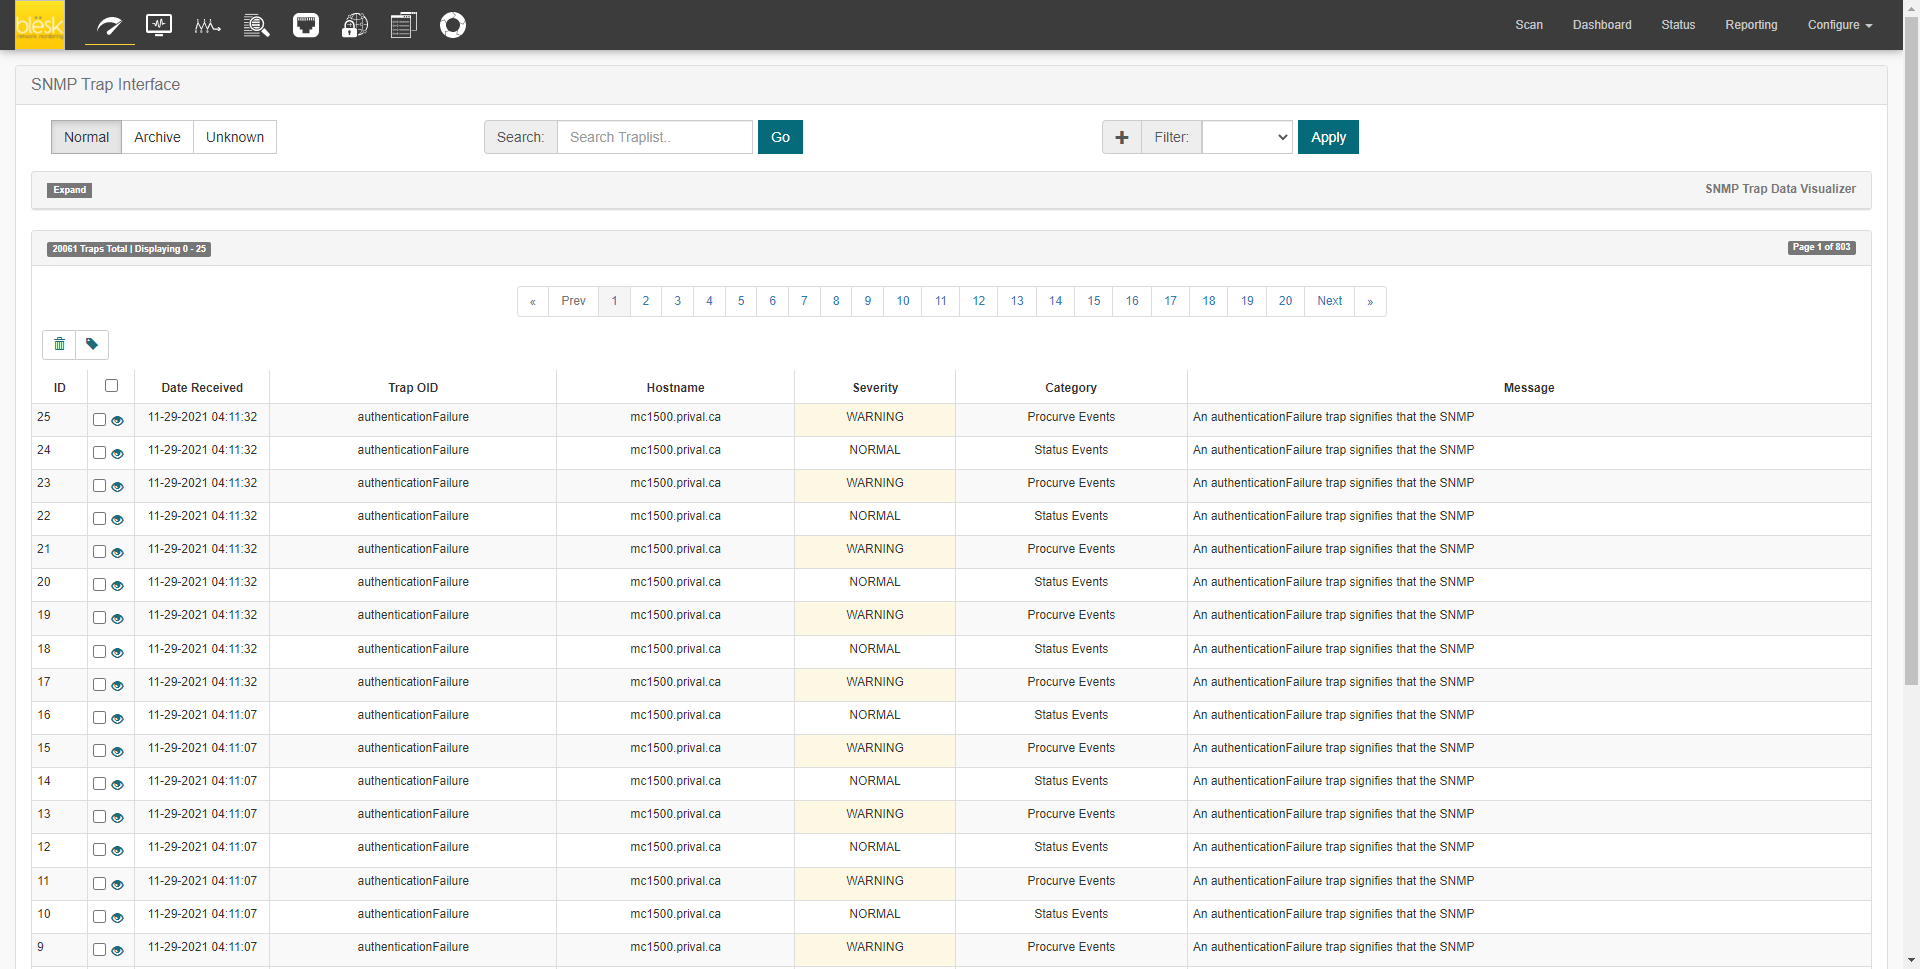
APM provides management of SNMP traps - including the ability to read, process, and generate alerts from SNMP traps it receives.
This view allows you to centralize all SNMP traps received from your network. The information is stored in an SQL database and displayed in a searchable table.
For each trap, you can see the time received, trap ID, IP address, category, degree of importance, and a portion of the content of the message.
In the majority of cases, if the trap is tagged as “Critical” then a message will be sent. It will continue to be sent until the administrator logs into the web interface and clears the message .
¶ Network Map
Network Map is a visualization add-on for APM that can be used to visualize APM data. For example, it can display IT processes such as a mail system or a network infrastructure. It will update the maps objects after certain intervals to reflect the current state.
Here are some examples of what Network Map can do:
- Display individual Hosts and Services
- Visualize a complete Host or Service group as a single icon
- Display the summary state of a Host and all its services
- Display only the major problems
- Sub-categorize icons representing a complete Map in a single icon (drill down)
- Visualization of complete IT processes using self drawn graphics
- Visualization of network traffic using weathermap lines
