The monitoring section is one of the most-used components of the administration tab and lets you manage hosts, services, host groups, services groups, host templates and service templates.

¶ Hosts
The “Hosts” menu allows us to set, create, modify, copy, delete, enable or disable hosts in APM. It is in this menu that we can manually manage new or existing hosts. On the left, we see the administration menu of the section named “Monitoring”.
Watch this Screencast, which demonstrates how to manually add a host in APM.
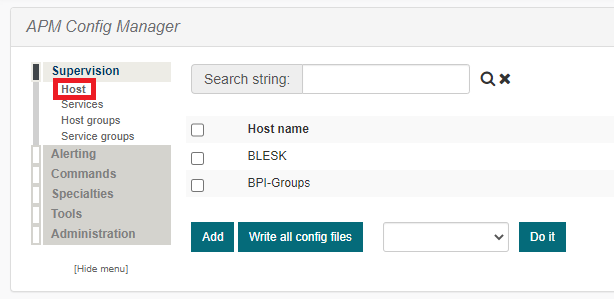
The central part of the screen lists the hosts that have already been created.

To create a host, you must click the “Add” button at the bottom of the page. The button “Write all config files” will write the modifications to the database. This is important because when creating or modifying a host, we must “export” the modifications to the database so that the system can see the changes.
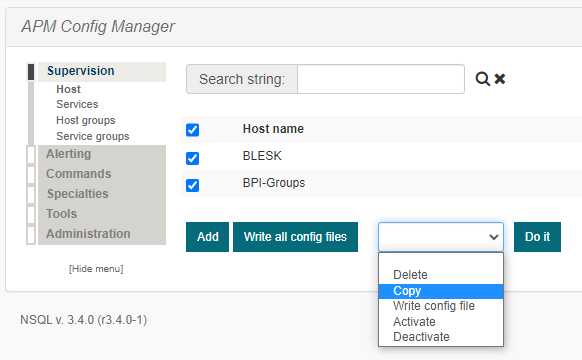
In order to make changes on multiple hosts at the same time, first, select them, and then at the bottom right of the page in the pulldown menu named “Marked”, select the action you want to perform and click “Do it”.
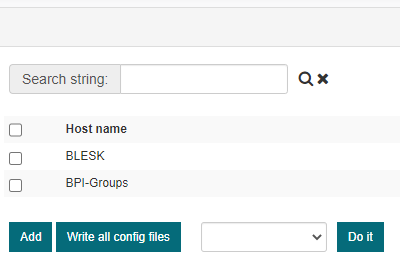
The “Search string” function allows you to perform a targeted search, which is very useful when you have to manage dozens of hosts.

Now we will explain the information and icons located to the right of the hosts table. The “Active” column shows you whether the host is active or not, then the “File” column reports the status of the configuration file as registered in the database (if you forget to write the modifications you will see a message “out of date ”. In the “Function” column, there are several small icons that correspond to actions.
The first allows you to modify the host. Clicking it will redirect you to the host configuration page. (We will see in detail the configuration page later in this document).
The second icon allows you to make a full copy of the host configuration. By clicking it you create a duplicate (clone) of the host already in place.
The third icon is for deleting a host, while the fourth icon allows you to save the host configuration in the database after modification. The fifth icon provides the option of downloading the configuration file.
The last icon displays information and dependency relationships between the host and other groups and services.

¶ Add host
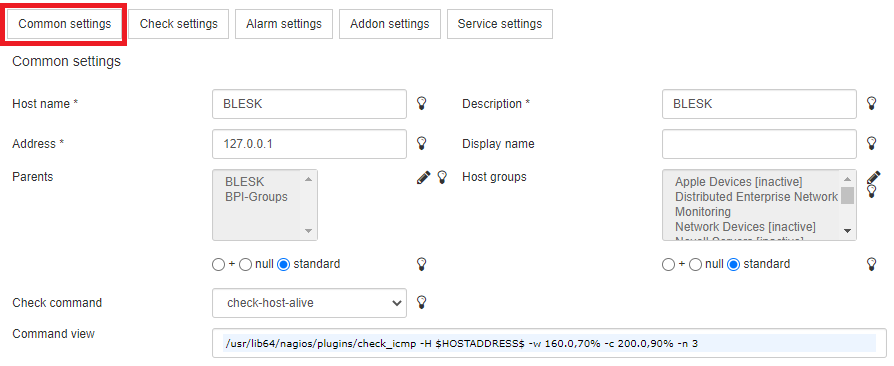
To add a host, click the “Add” button to access the host creation page. The settings options are divided into five groups (tabs) “Common settings”, “Check settings”, “Alarm settings”, “Addonsettings” and “Service settings”.

¶ Common settings
Items in red are required fields. In the “Common settings” section, mandatory fields are: ”Host name “, ”Address “ and ”Description “. In the ”Host name “ field enter the name of the machine.
Enter a description in the ”Description “ field, then the address of the machine (IP address or a host name that is resolvable) in the ”Address “ field. Once the information is entered, click the “Save” button at the bottom of the page.
¶ Check settings
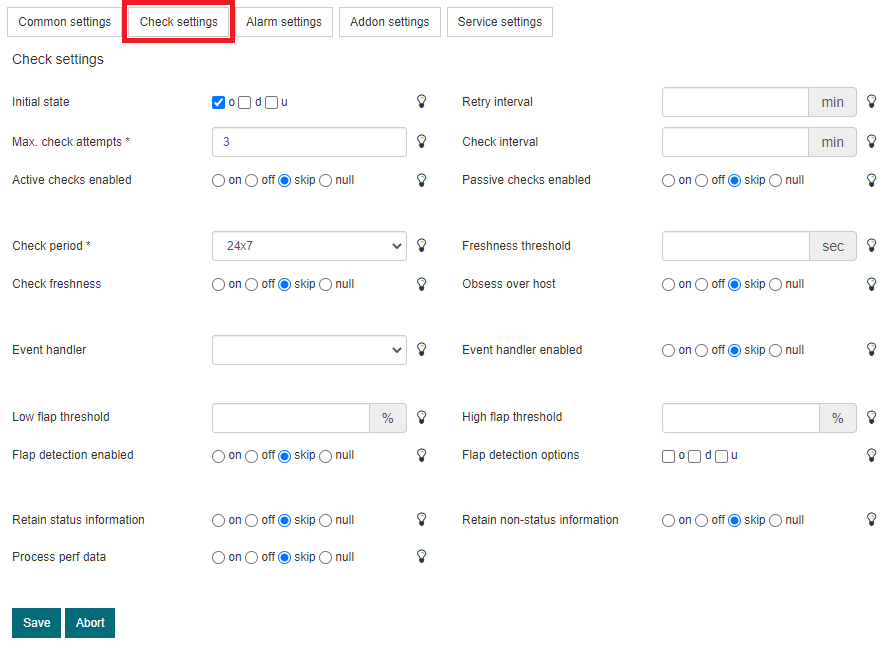
In the “Check settings” tab, required fields are: “Max. check attempts ” and “Check period ”. The field “Max. check attempts ” is used to define the number of times that APM will retry the host check command if it returns any state other than an OK.
The “Check period ” directive is used to specify the short name of the time period during which active checks of this host can be made (all time periods are created under the ‘Notifications’ (Link to be added) section of the administrative panel).
¶ Alarm settings
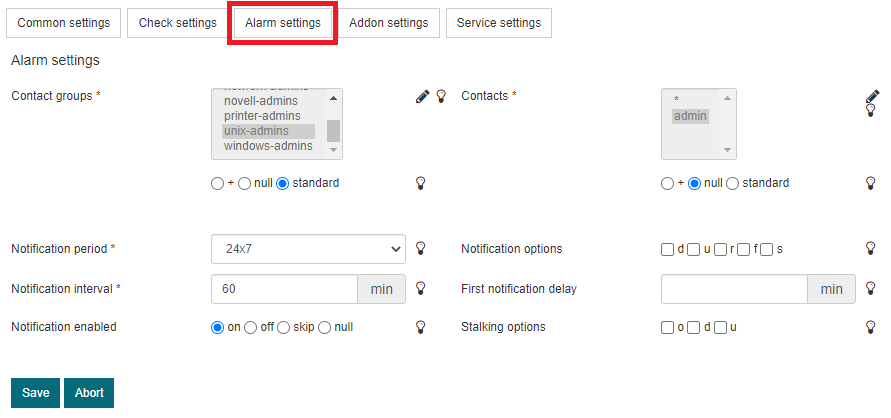
In the “Alarm settings” tab, you must complete the ”Contacts “, ”Contact groups “, ”Notification period “ and ”Notification interval “ fields.
The ”Contacts “ directive would be useful if you wanted to alert a small number of people, otherwise, it is better to use the ”Contact groups “ field. You must therefore choose between ”Contacts “ or ”Contact groups “. In our example, ”Contact groups “ was selected because we noted that the “standard” parameter is checked. For ”Contacts “ the parameter is set to ”null“, meaning disabled.
The third directive ”Notification period “ is used to specify the short name of the time period during which notifications of events for this host can be sent out to contacts.
The “Notification interval ” field is used to define the number of “time units” in minutes to wait before re-notifying a contact if a service is still down or unreachable.
¶ Addon settings
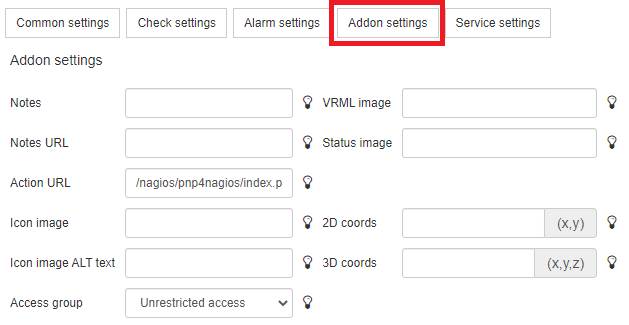
In the “Addon settings” tab, you will find options related mainly to esthetics. Here you can find an option for adding an icon to represent a host and other non-mandatory options.
For example, the small icon that provides a graphical view of the host services performance data was added via a special parameter defined in the “Actions URL”. Here is the string that you can copy and paste if you wish to use this feature:
/nagios/pnp4nagios/index.php/graph?host=$HOSTNAME$
¶ Service settings
In the last tab, you will be able to choose from a list of over 230 predefined services. To add a service simply select the service you wish to add and click the arrow to add it to the ”selected“ box.

¶ Services
The “Services” menu presents the same interface as the “Hosts” menu. The options presented here are very similar to those found in the “Hosts” menu.
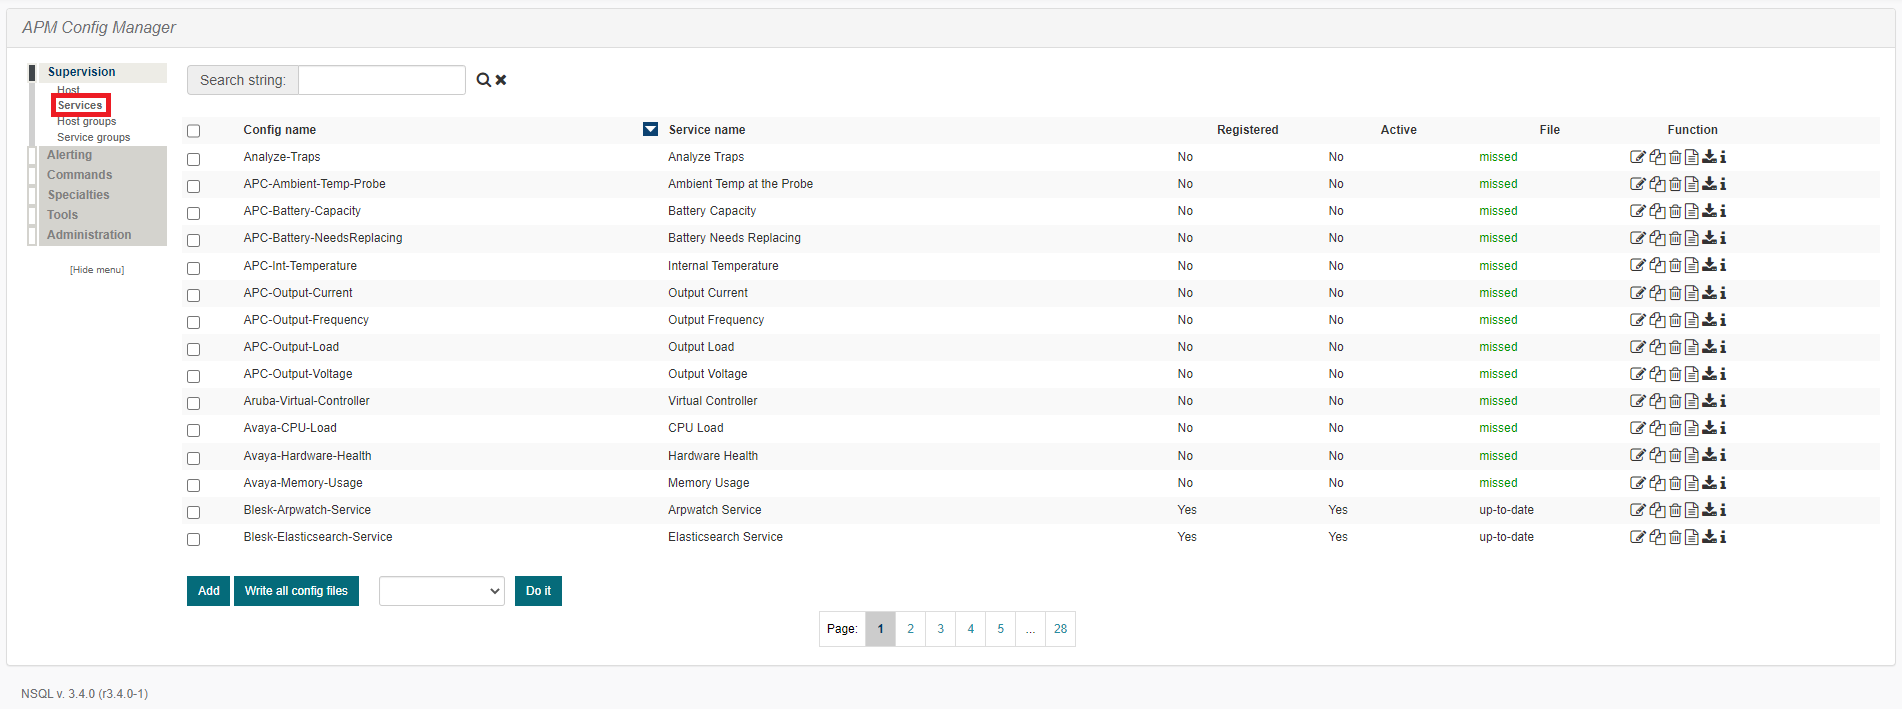
The central part of the screen lists the services that have already been created.

¶ Add service
To add a service. click the “Add“ button to access the service creation page. The settings options are divided into four groups (tabs) “Common settings”, “Check settings”, “Alarm settings” and “Addonsettings”.

¶ Common settings
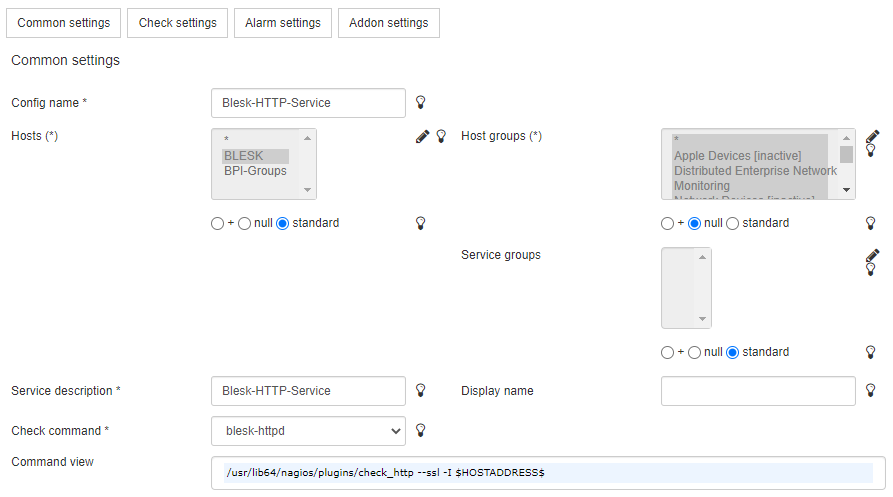
Items in red are required fields. In the “Common settings” section, mandatory fields are: “Config name ”, “Hosts ”, “Service description ”, “Check command ” and “Host groups ”.
In the “Config name ” field, enter the name of the service definition.
The “Hosts ” directive is useful if you wish to select the host(s) on which the service runs or is associated with, otherwise it is better to use the “Host groups ” field which specifies the hostgroup(s) on which the service runs or is associated with.
The “Host groups ” may be used instead of, or in addition to, the “Hosts ” directive. In our example, “Hosts ” is selected because we noted that the “standard” parameter is checked. For “Host groups ” the parameter is set to ”null”, meaning disabled.
Enter a description in the “Service description“ field. Next enter the command that Application Performance Monitor will run in order to check the status of the service listed in the ”Check command “ field.
¶ Check settings
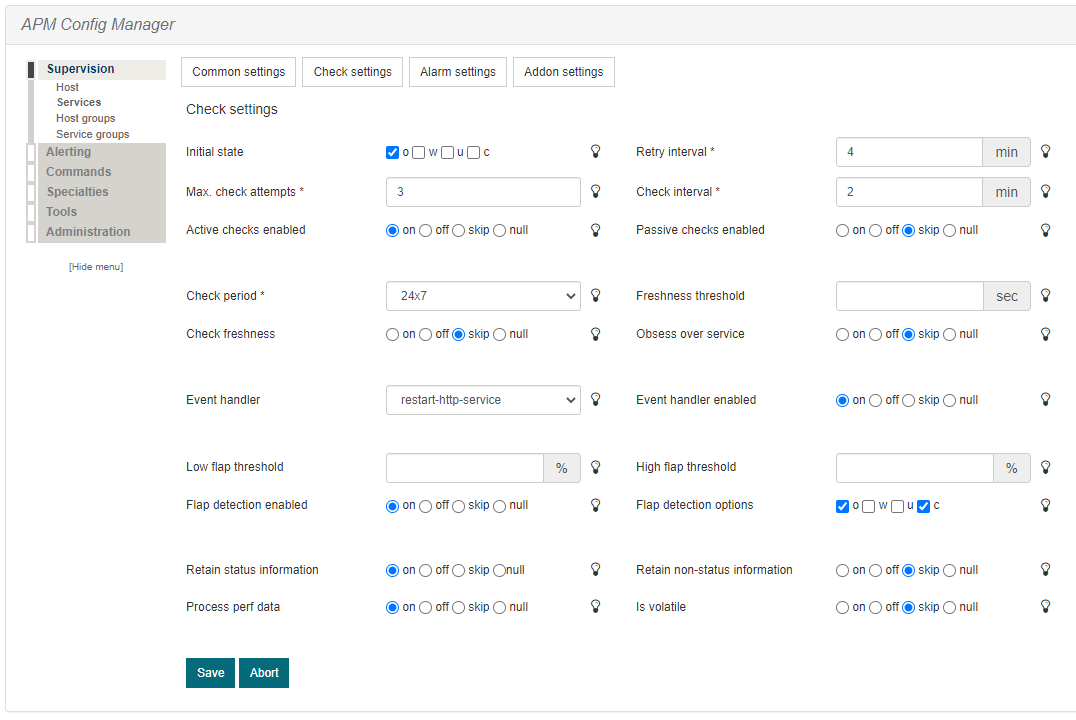
In the tab “Check settings” required fields are: “Max. check attempts ”, “Check period ”, ”Retry interval “ and ”Check interval “.
The field “Max. check attempts ” is used to define the number of times that APM will retry the service check command if it returns any state other than OK.
The “Check period ” directive is used to specify the name of the time period during which active checks of this service can be made (all time periods are created under the ‘Notifications’ section of the administrative panel).
The directive “Retry interval ” is used to define the amount of time (in minutes) to wait before scheduling a re-check of the service. Services are rescheduled at the retry interval when they have changed to a non-OK state.
The ”Check interval “ directive is used to define the amount of time (in minutes) to wait before scheduling the next “regular” check of the service. “Regular” checks are those that occur when the service is in an OK state.
¶ Alarm settings
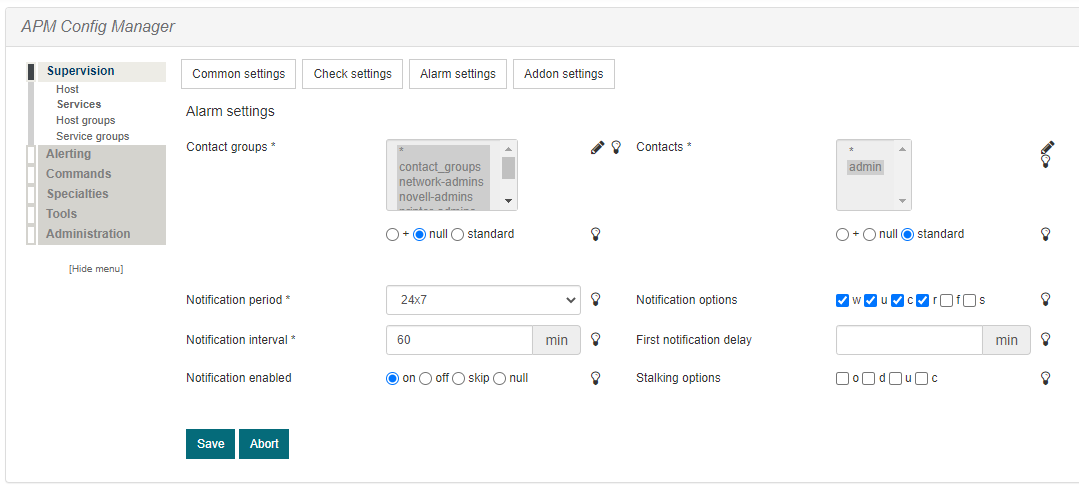
In the “Alarm settings” tab, you must complete the “Contacts ”, “Contact groups ”, “Notification period ” and “Notification interval ” fields.
The “Contacts ” directive would be useful if you want to alert a small number of people, otherwise it is better to use the “Contact groups ” field. You must therefore choose between “Contacts ” or “Contact groups ”. In our example, “Contact ” is selected because we noted that the “standard” parameter is checked. For “Contacts groups ” this parameter is set to ”null”, meaning disabled.
The third directive “Notification period ” is used to specify the short name of the time period during which notifications of events for this host can be sent out to contacts.
The “Notification interval ” field is used to define the number of “time units” in minutes to wait before re-notifying a contact that this service is still down or unreachable.
¶ Addon settings
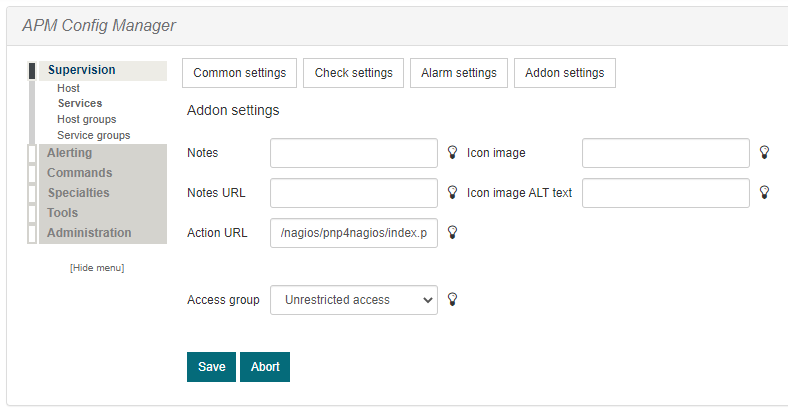
In the “Addonsettings” tab, you will find esthetic options. Here you can find an option for adding an icon to represent a host, and other non-mandatory options.
For example, the small icon that provides a graphical view of the service performance data was added via a special parameter defined in the “Actions URL”. Here is the string that you can copy and paste if you wish to use this feature:
/nagios/pnp4nagios/index.php/graph?host=$HOSTNAME$&srv=$SERVICEDESC$
¶ Host Groups
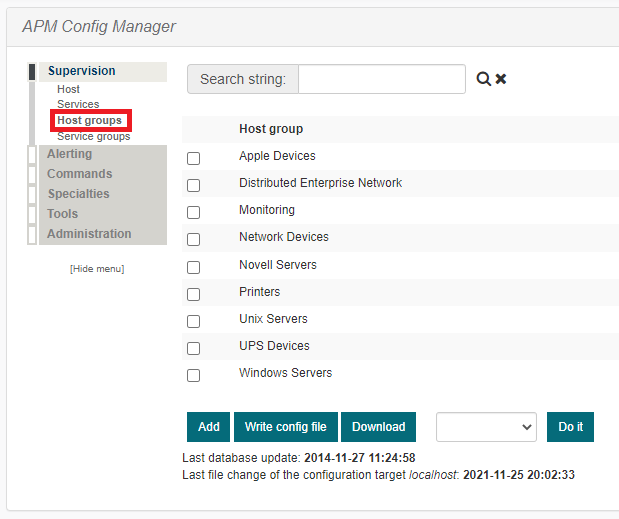
The “Host groups” menu is used to group one or more hosts together in order to simplify configuration, or to structure your view according to your preferences.
¶ Add host groups
To add a host group click the “Add“ button. The host groups creation page will appear. Here you have two mandatory fields: ”Host group name ” where you enter the desired group name, and in the second field you must provide a brief description for the group. The other fields are optional when creating the group.
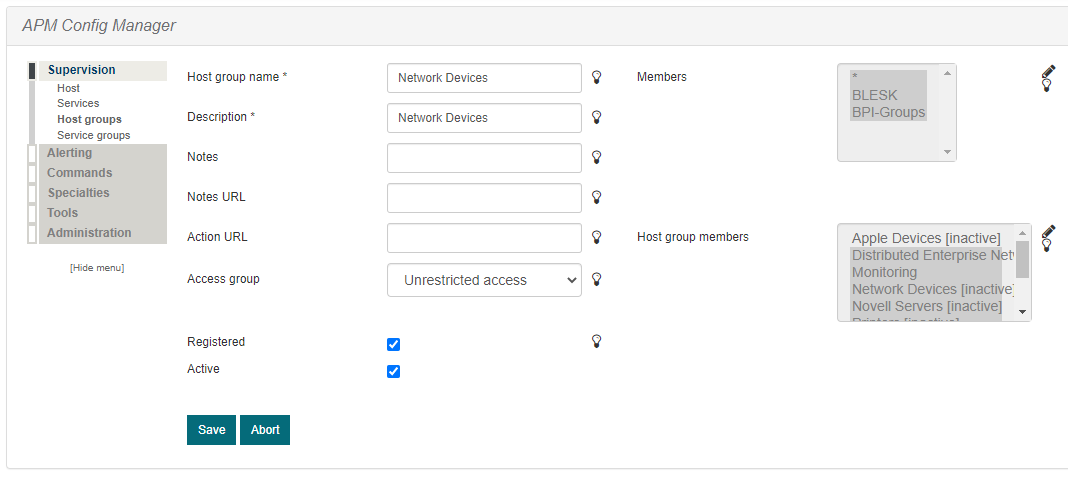
To add hosts at the time of group creation, you can use the “Members” or “Host groups members” section. The “Members” section can also be used instead of the “Host groups” section in service creation to manage groups. You can use either of these if you wish.
The “members” section will let you add individual servers to the group whereas the “Host group members” section will let you add other existing host groups. Check that the “Active” checkbox is checked, then click the “Save” button.
¶ Service Groups
The “Service groups” menu is used to group one or more services together for simplifying configuration.

¶ Add service groups
To add a service group, click the “Add“ button. The service groups creation page will appear. Here you have two mandatory fields: “Service group name ” where you enter the desired service name, and in the second field you must provide a brief description for the service. Other fields are optional when creating the service group.
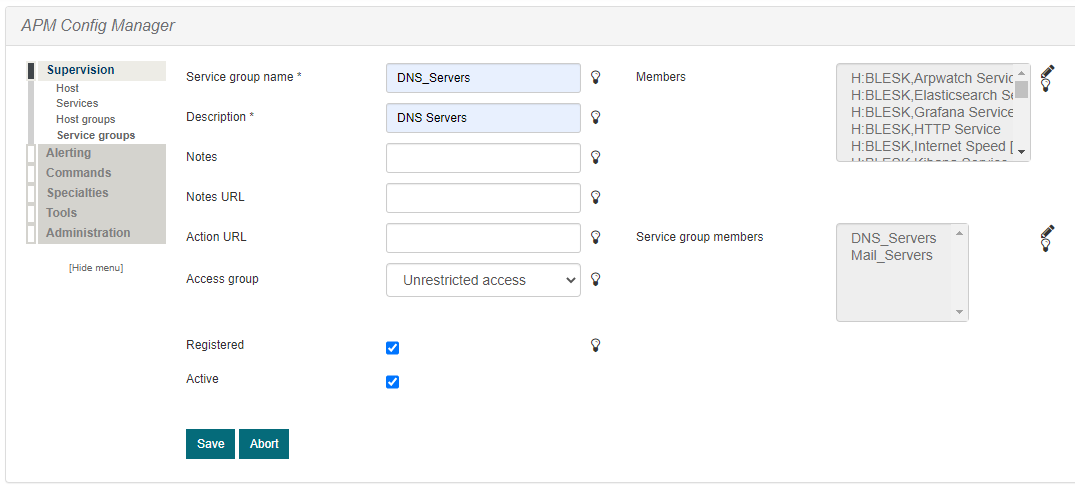
To add services at the time of service group creation, you can use the “Members” or “Service groups members” section.
The “members” section will let you add individual services to the service group whereas the “Service group members” section will let you add other existing service groups.
The main difference between “Host groups” and “Service groups” is that with “Service groups” you can for example, group together all web services available from different servers in your enterprise under the same list.