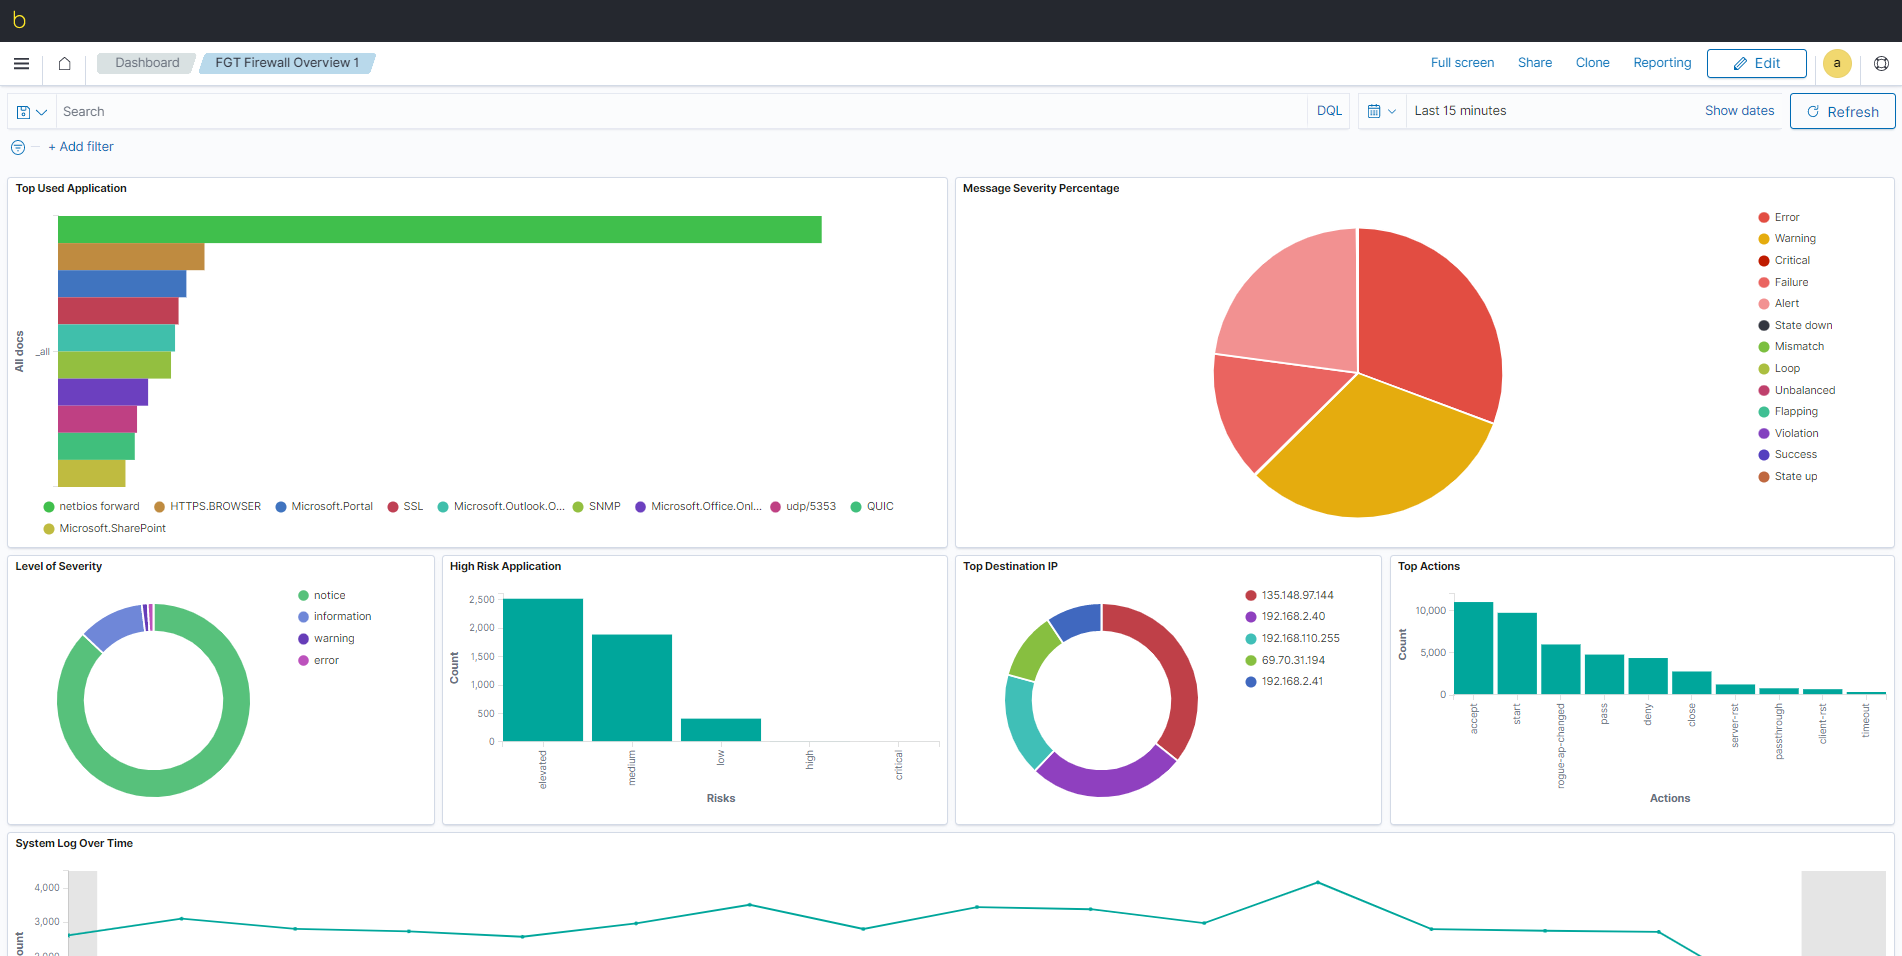
blësk Event Log Manager (ELM) Dashboards is the default visualization tool that makes it easy for users to explore their data in the blësk ELM. From real-time application monitoring, threat detection, and incident management to personalized search, ELM Dashboards give you the data visualizations needed to graphically represent trends, outliers, and patterns in your data. blësk ELM Dashboard also serves as a user interface for many of the ELM plugins, including security, alerting, Index State Management, SQL, and more.
¶ Create Dashboards
blësk ELM Dashboards provide you with the space where you add panels of your data.
¶ Open a dashboard
Begin with an empty dashboard, or open an existing dashboard.
- Open the main menu, then click Dashboard.
- On the Dashboards page, choose one of the following options:
- To start with an empty dashboard, click Create dashboard.
When you create a dashboard, you are automatically in edit mode and can make changes to the dashboard.
- To open an existing dashboard, click the dashboard Title you want to open.
When you open an existing dashboard, you are in view mode. To make changes to the dashboard, click Edit in the toolbar.
Create and add panels
You create panels using the editors, which you can access from the dashboard toolbar or the Visualize Library, or add panels that are saved in the Visualize Library, or search results from Discover.
To create panels from the dashboard toolbar, use one of the following options:
- Create visualization — Click on the Edit button from the top toolbar will open the drag-and-drop editor, which is the recommended way to create visualization panels.

⇓
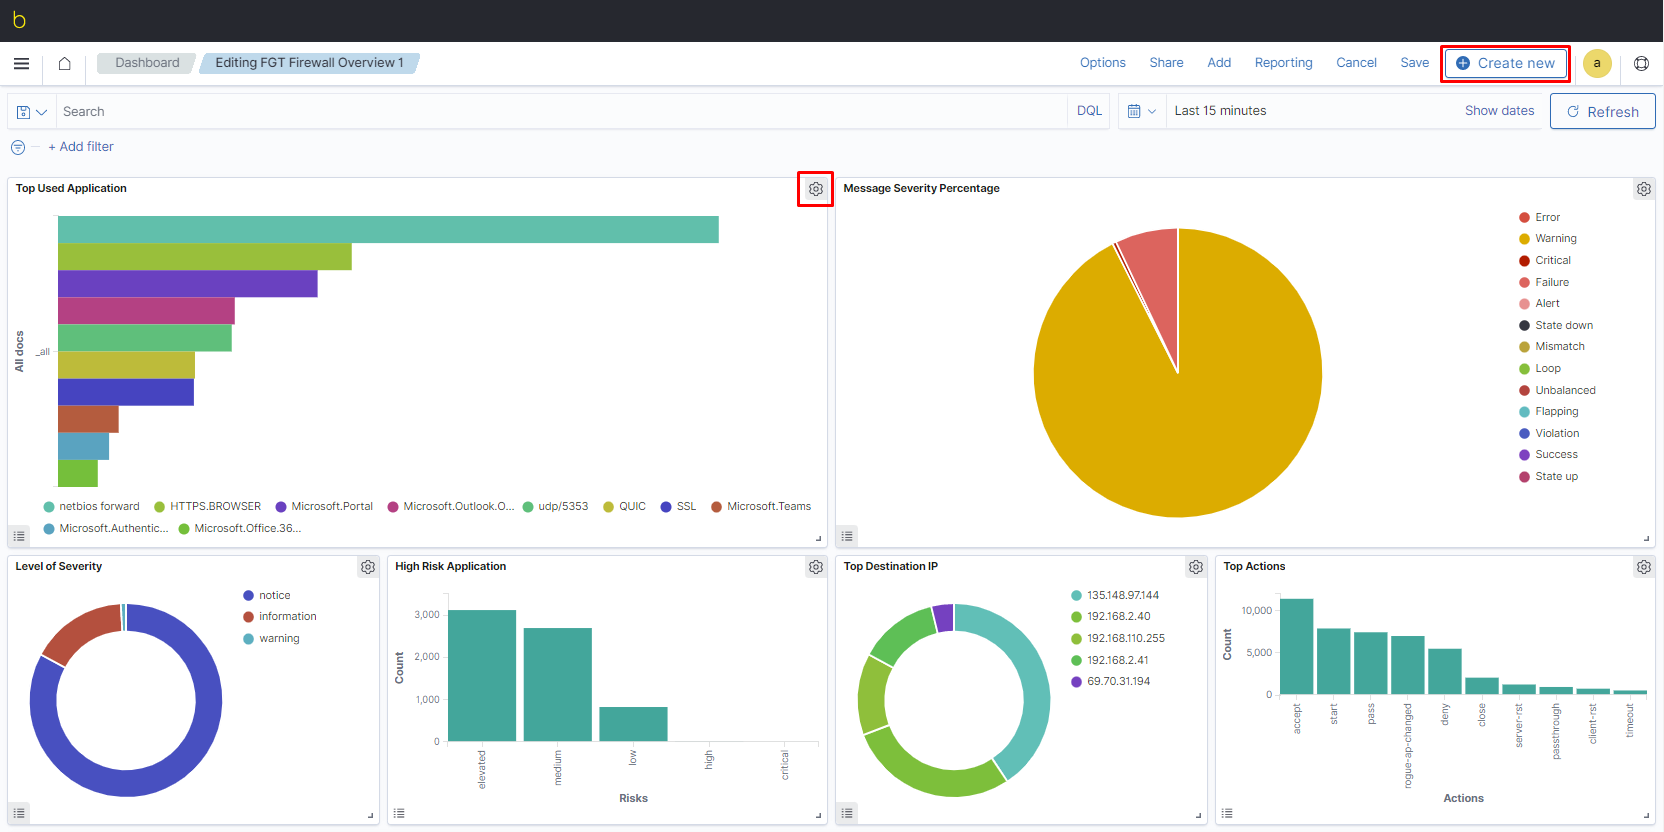
Note: Upon clicking the Edit button it turns into Create new button and the drag-and-drop editor option activates.
- Select type — By clicking on the Create new button will Open the menu for all of the editors and panel types.
To create panels from the Visualize Library:
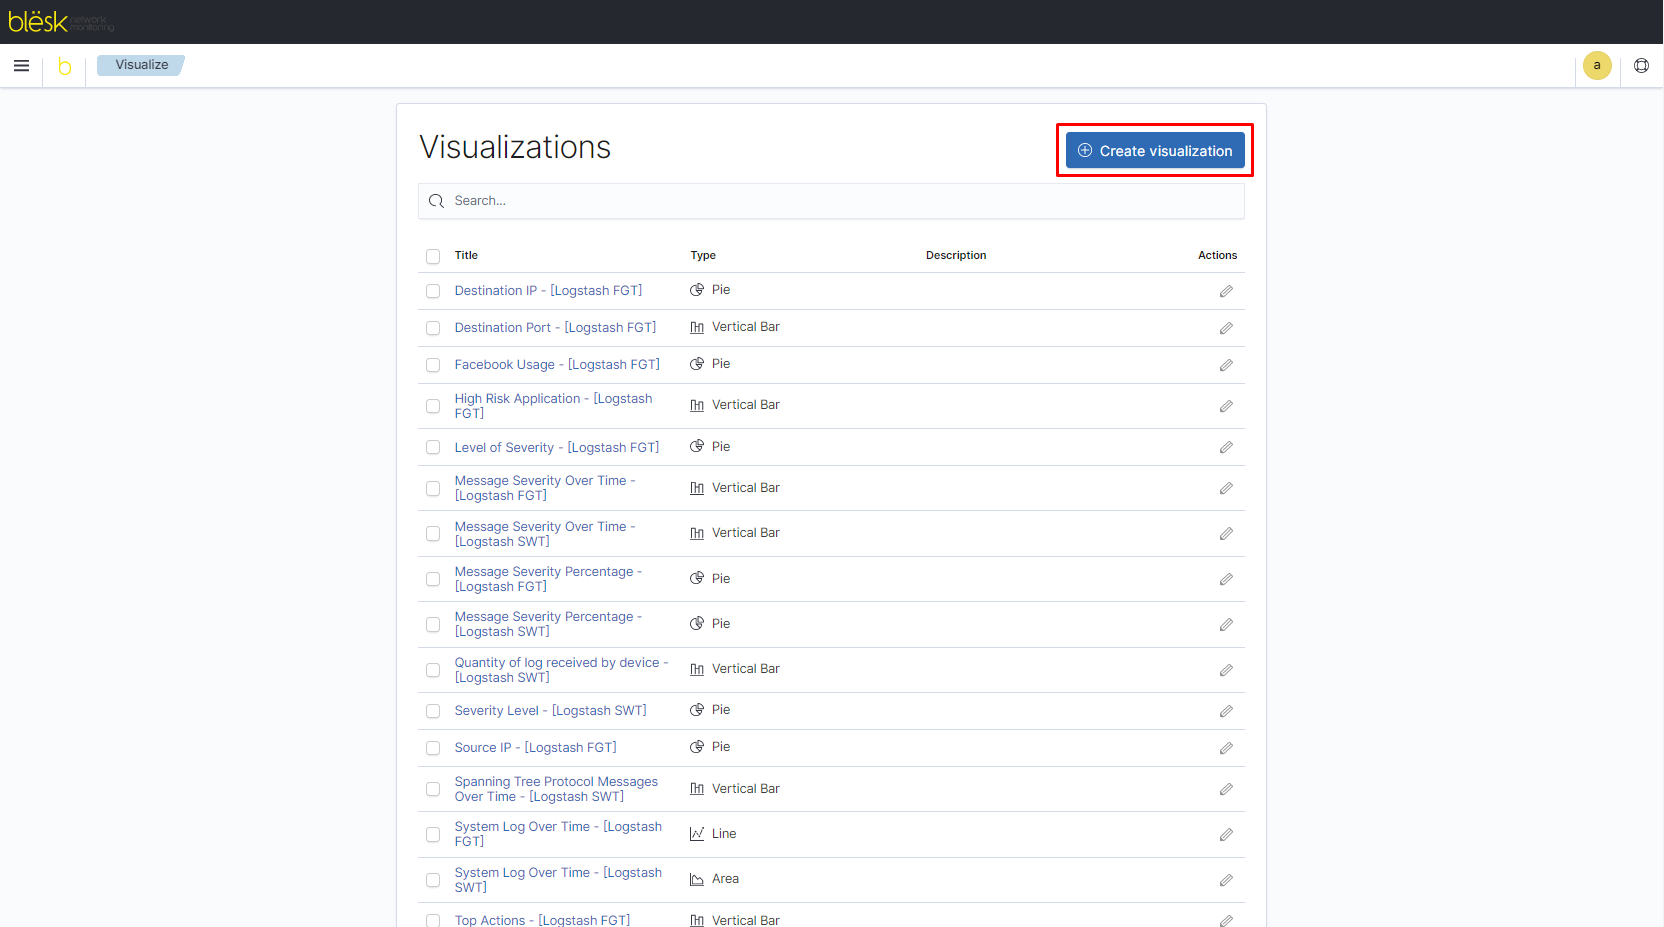
- Open the main menu, then click Visualize to open the list of Visualize Library.

2. Click Create visualization.
3. Select an editor from the list of visualization types.
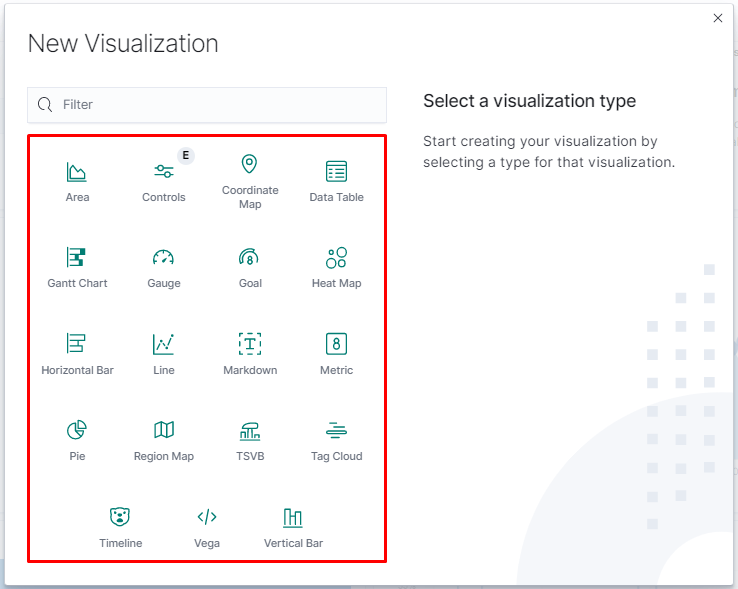
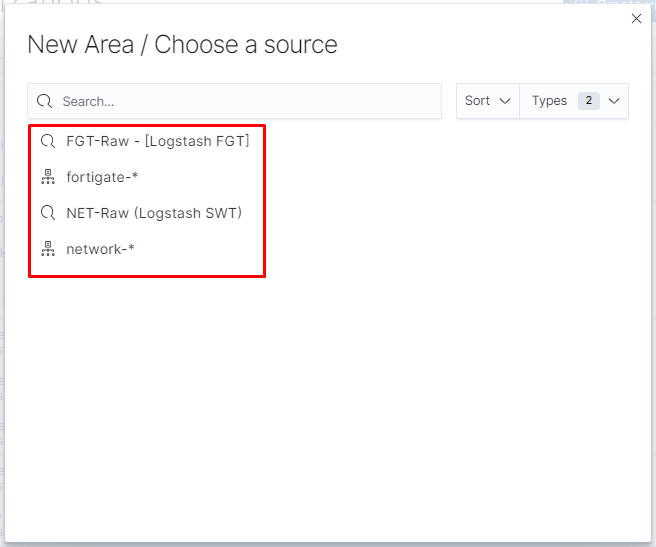
4. Choose the source from the list.
5. Set the parameters from the right-hand pane.
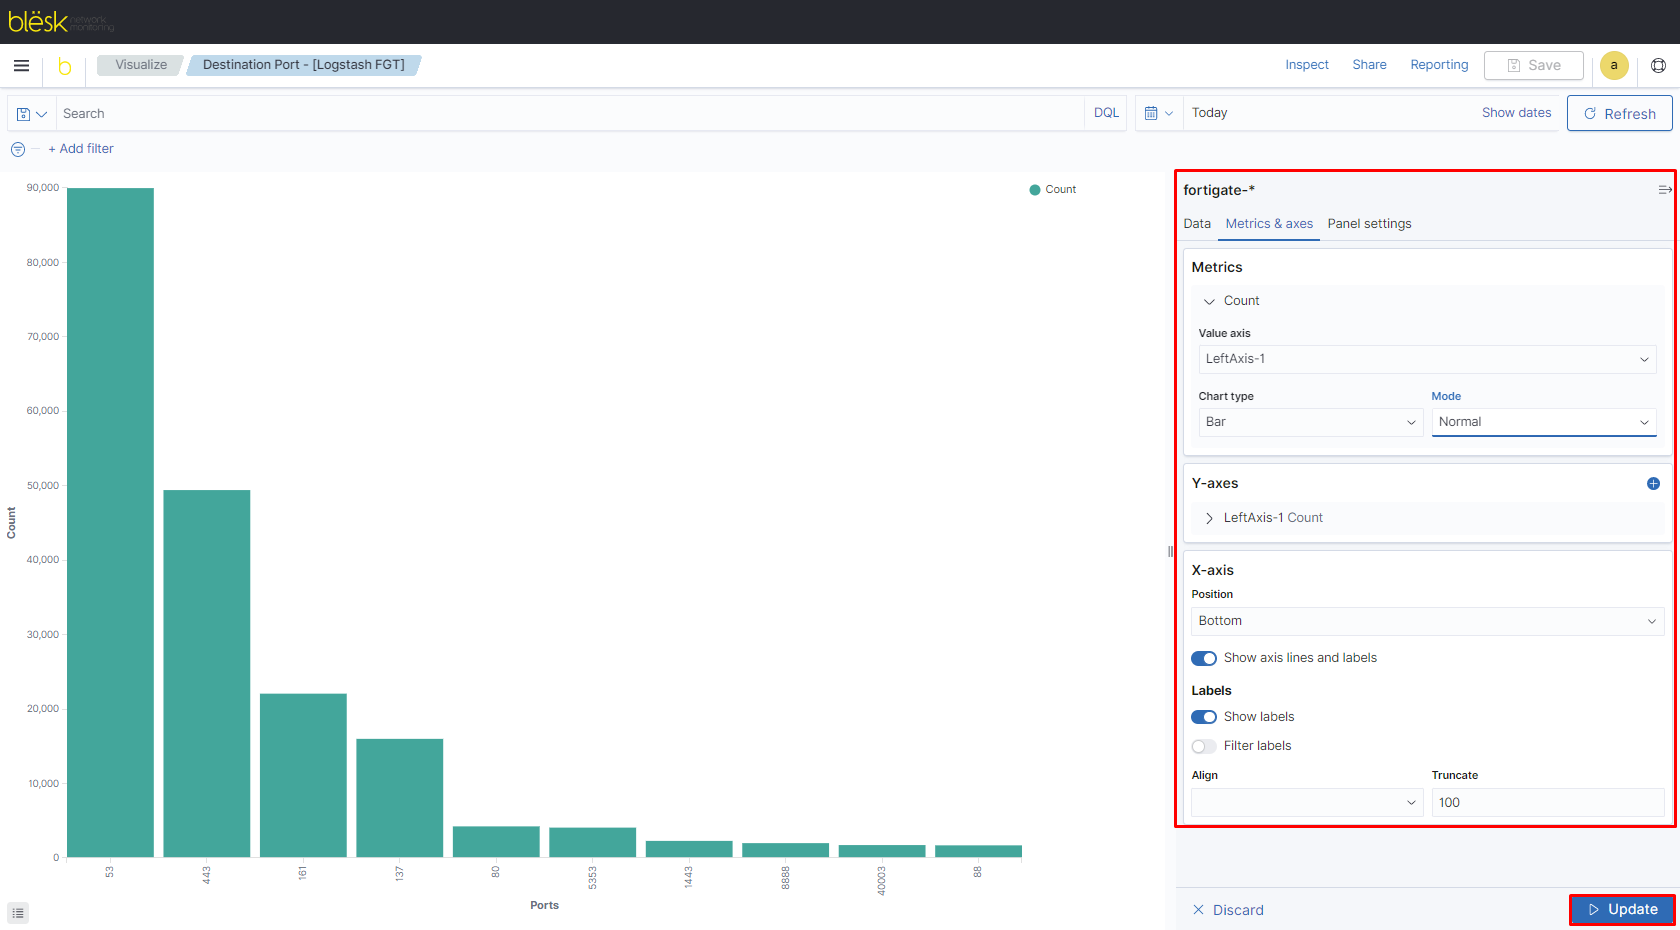
6. Click Update.

7. Click Save on the top toolbar to save the visualization to the Dashboard.
To add existing panels from the Visualize Library:
- In the dashboard toolbar, click Add on the toolbar, while in Edit mode.
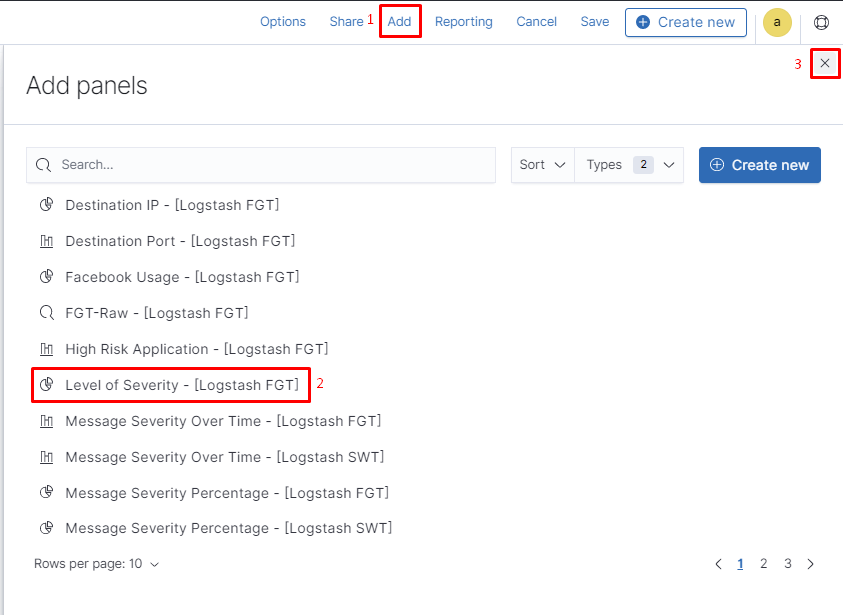
2. Click the panel you want to add to the dashboard, then click X to return to the Dashboard.
Note:
When a panel contains a saved query, both queries are applied.
When you add search results from Discover to dashboards, the results are not aggregated.
¶ Filter the data
To view a subset of the data, you can apply filters to the dashboard data. The steps for adding a filter are as the following:
- Click Add filter.
- From the Field dropdown, select the parameter.
- From the Operator dropdown, select an operator.
- From the Value dropdown, select column value.
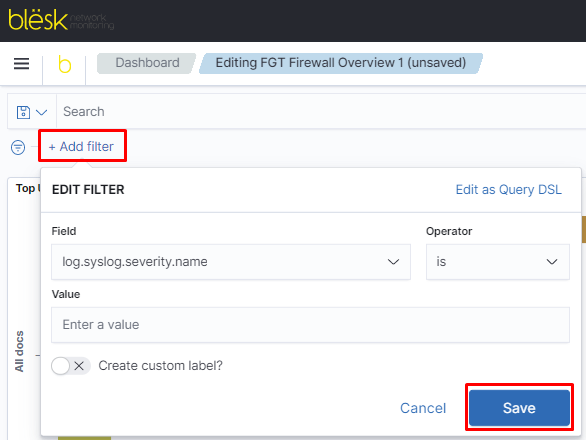
5. Click Save to apply the filter.
¶ Options
Apply a set of design options to the entire dashboard.
- If you’re in view mode, click Edit in the toolbar.
- In the toolbar, Options, then use the following options:
- Use margins between panels — Adds a margin of space between each panel.
- Show panel titles — Displays the titles in the panel headers.
¶ Share dashboards
To share the dashboard with a larger audience, click Share in the toolbar.
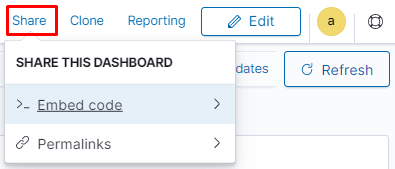
It allows to share in two different ways;
- Embed code
- Permalinks
Embed code
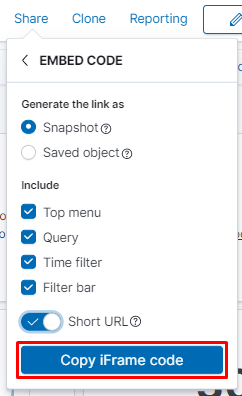
To Embed code on an HTML page, click on Embed code, check the options you would like to include in the dashboard, and click Copy iFrame code to embed that in a webpage.
Permalinks
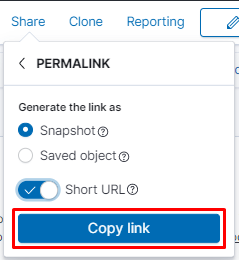
To share code as permalinks, click on the Permalinks option and check the options as you would like to share the dashboard and click Copy link.
¶ Clone
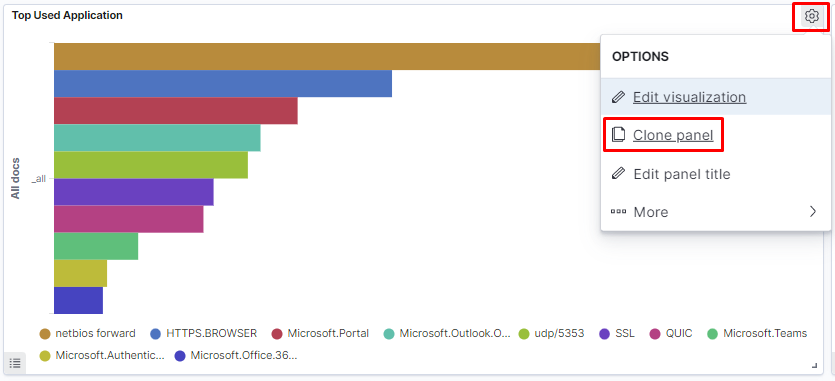
To duplicate a panel and the configured functionality, use the clone and copy panel options. Cloned and copied panels replicate all of the functionality from the original panel, including renaming, editing, and cloning.
- In the toolbar, click Edit.
- Open the panel menu, then select Clone panel.
