¶ Introduction
The blësk Event Log Manager module (ELM) is a user friendly way to view, search, and visualize your log data. It provides a high level of visibility that will have you identifying issues, and creating solutions, faster than ever before. Your applications generate the data, and ELM receives it, structures it, boosts fields, ranks results by score, sorts results by field, aggregates results, and stores them in the database to make it available to you through a convenient search feature.
See the Quick Start guide to know how to configure your network components to send logs and events to ELM.

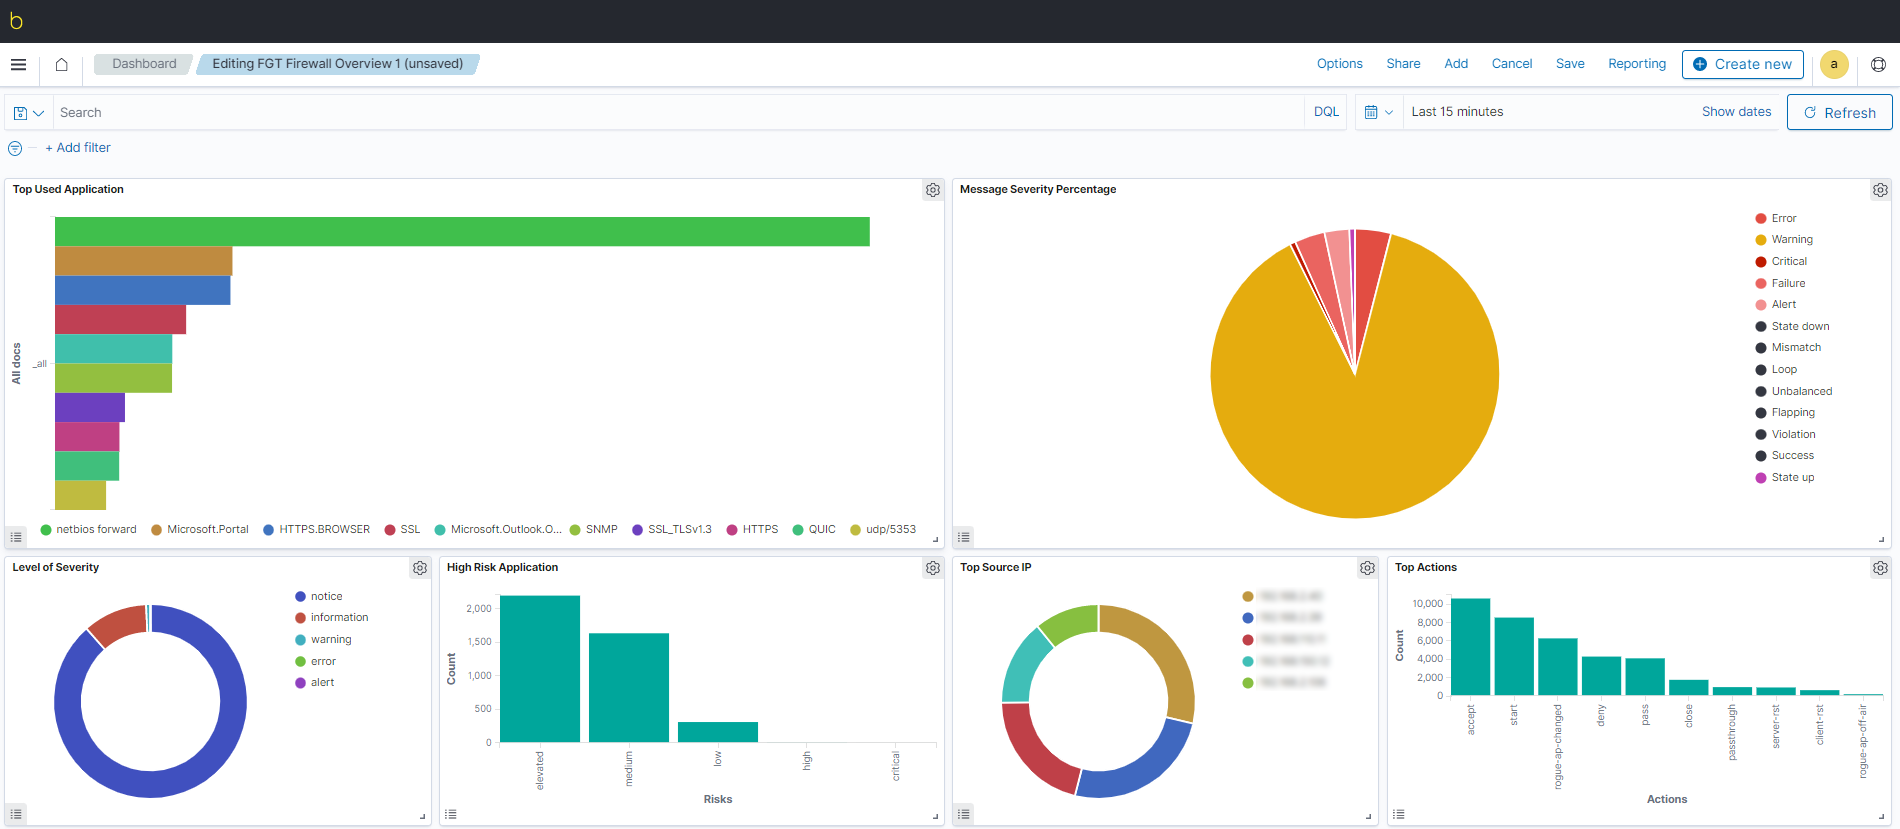
A use case of blësk ELM is to perform log analytics, in which you take the logs from an application, network device, server, feed them into ELM, and use the rich search and visualization functionality to identify issues. For example, a malfunctioning web server might throw a 500 error 0.5% of the time, which can be hard to notice unless you have a real-time graph of all HTTP status codes that the server has thrown in the past four hours. You can use ELM Dashboards to build these sorts of visualizations from data in ELM.