This Quick Start guide will help you to start using the blësk Event Log Manager (ELM) after installing the blësk Network Monitoring system.
¶ Introduction
Event Log Manager (ELM) provides super fast access to log files it receives from the network. It can be used to centralize all log files and events from all your network servers and devices. This document explains how to configure network devices such as Switches, Routers, or Firewalls to send log messages to a Monitoring Server like blësk. Please take note that commands, as explained in this document, may vary according to your device version and model.
¶ Enable System Logs on Cisco
Use Telnet or SSH to connect to your Switch/Router, then enter the following commands to enable and configure system log messages to be exported to your blësk server.
conf t
no service sequence-numbers
no service timestamps debug uptime
no service timestamps log uptime
logging trap warnings
logging x.x.x.x
exit
write memNote: The above commands will set it to log everything to the IP or hostname of the blësk Server.
¶ Enable System Logs on PIX/ASA 55xx
Use Telnet or SSH to connect to your Firewall, then enter the following commands to enable and configure system log messages to be exported to your blësk server.
conf t
logging enable
logging host <interfacename> x.x.x.x
no logging timestamp
no logging device-id
logging trap alerts
logging facility 23
exit
write memNote: The above would set it to log everything to the IP of the blësk Server. <interfacename> represent the Interface Name on which you want to allow SNMP (i.e. Internet, outside, etc.)
¶ Enable System Logs on Brocade
Use Telnet or SSH to connect to your switch, then enter the following commands to enable and configure system log messages to be exported to your blësk server.
conf t
logging host <ip or hostname of monitoring server>
logging facility local7
logging buffered 100
logging enable user-login
logging enable config-changed
no logging buffered debugging
no logging buffered informational
exit
write memNote: The above commands will set it to log everything to the IP or hostname of the blësk Server.
¶ Enable System Logs on DELL
Use Telnet or SSH to connect to your switch, then enter the following commands to enable and configure system log messages to be exported to your blësk server.
configure
logging on
logging <ip or hostname of monitoring server>
exit
copy running-config startup-configNote: The above commands will set it to log everything to the IP or hostname of the blësk Server.
¶ Enable System Logs on HP
Use Telnet or SSH to connect to your switch, then enter the following commands to enable and configure system log messages to be exported to your blësk server.
conf t
logging <ip or hostname of monitoring server>
logging facility syslog
exit
write memNote: The above commands will set it to log everything to the IP or hostname of the blësk Server.
¶ Enable System Logs on FortiGate
You’ll need to go in via the CLI as they have removed this option from the GUI as of FortiOS v5.0, then enter the following commands to enable and configure system log messages to be exported to your blësk server.
config global
config log syslogd setting
    set status enable
    set server [ip.or.dns-name.here]
    set port 514
endTo set the level of messages you want to see (optional).
config log syslogd filter
set severity warning¶ Enable System Logs on Windows
Windows don’t come with software to export system logs externally. You have to find one from a third party and install it to be able to have your syslogs sent to an external host like blësk. Here is a page explaining how to install free software provided by us and capable to do the job.
¶ Enable System Logs on Avaya/Nortel
To configure Syslog servers for the cluster, use the following command.
/cfg/sys/syslog followed by: add x.x.x.x *Note x.x.x.x is the IP address of the Syslog server (blësk). * is the facility — the local facility number, to uniquely identify Syslog entries. We use * here to cover all facilities or all priorities.
¶ Index Patterns
blësk ELM requires an index pattern to access the data that you want to explore. An index pattern selects the data to use and allows you to define the properties of the fields. An index pattern can point to one or more indices, data stream, or index aliases. For example, an index pattern can point to your log data from yesterday or all indices that contain data.
¶ Create an index pattern
Follow the steps below to create an index pattern:
- Open the main menu, then click on Stack Management > Index Patterns.

2. Click Create index pattern.

3. To create some index patterns like network-*, fortigate-* and winlogbeat-*, start typing in the Index pattern field, and blësk ELM looks for the names of indices, data streams, and aliases that match your input. To match multiple sources, use a wildcard (*). For example, network-* matches network-a, network-b, and so on.
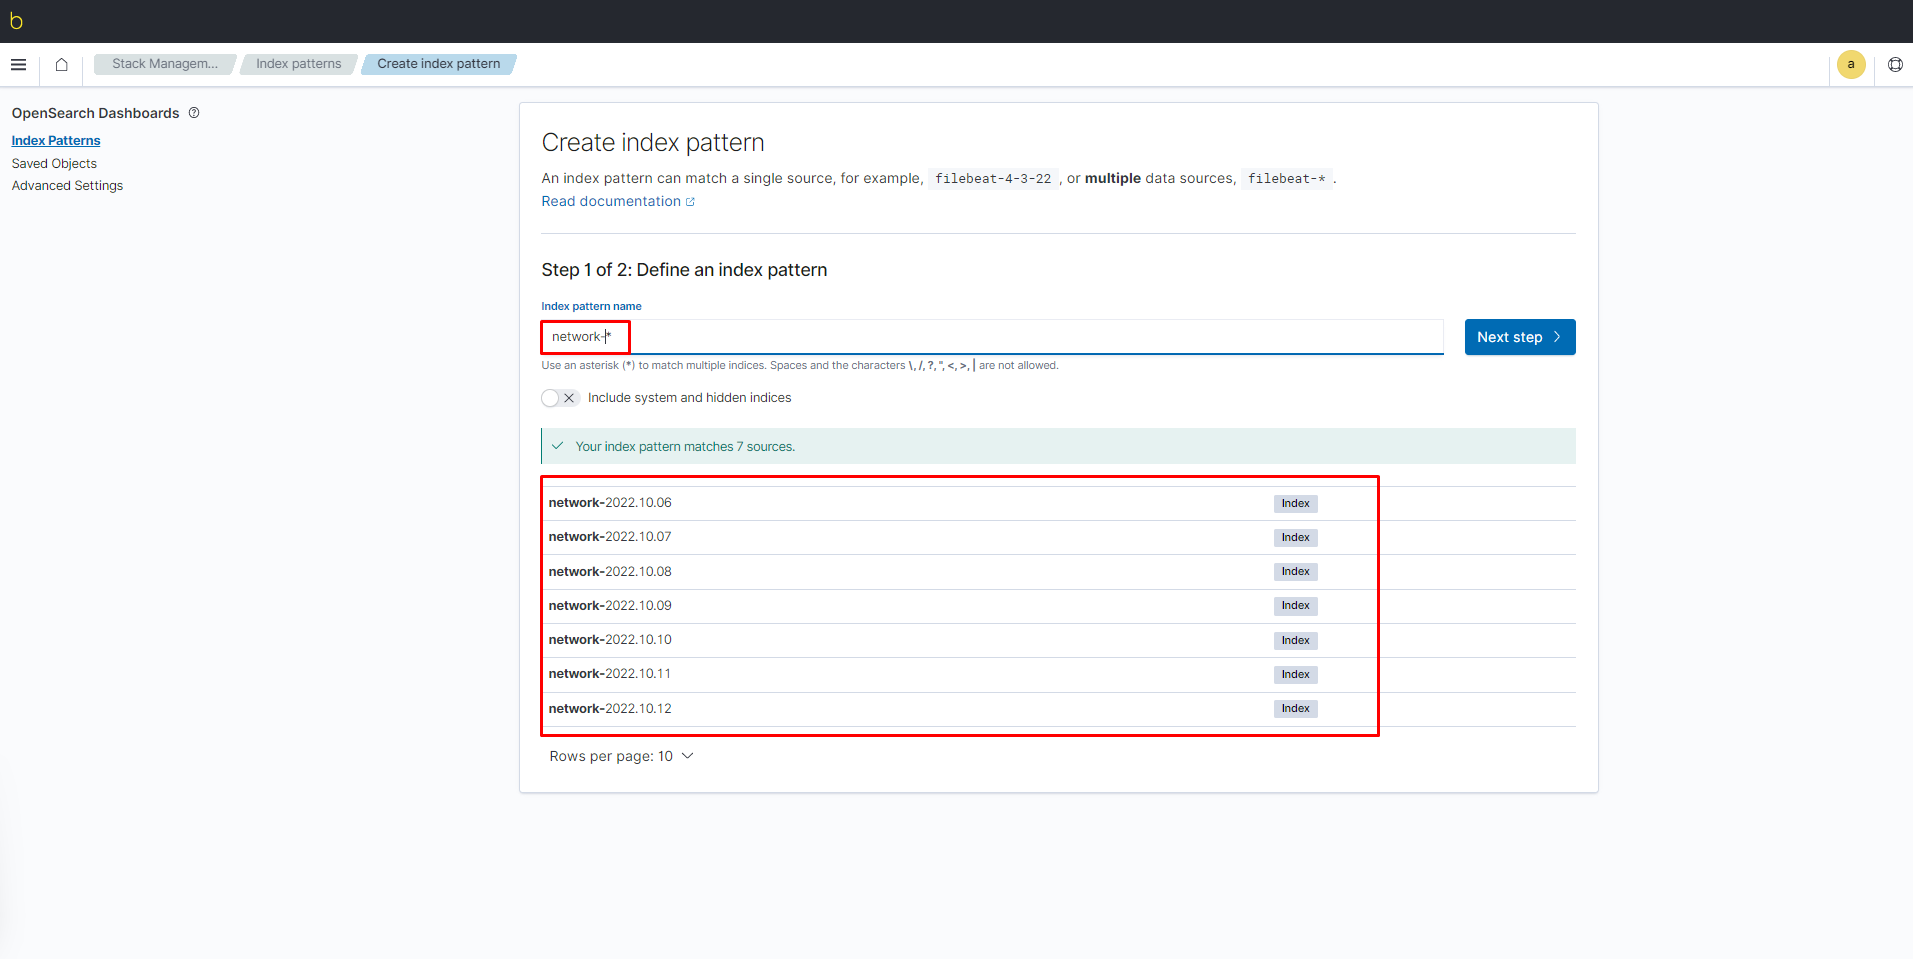
4. Click the Next step button.
5. Select the timestamp option in the Time field dropdown field.
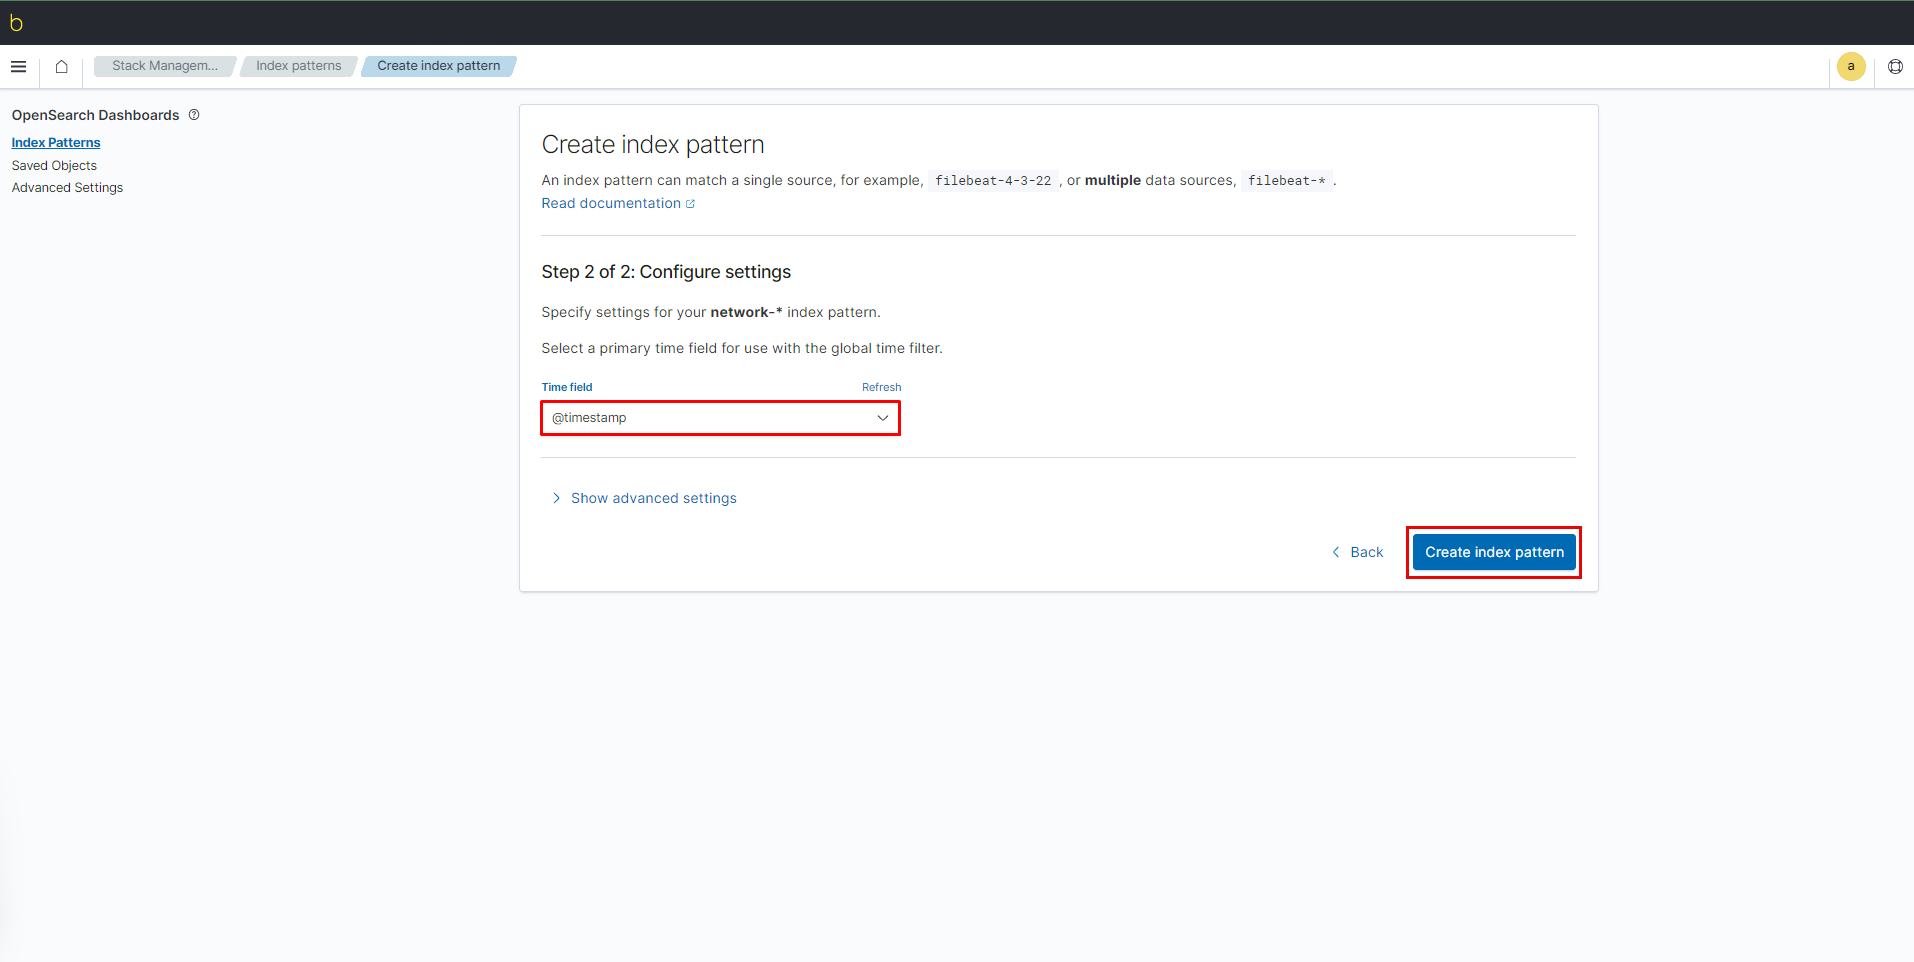
6. Click Create index pattern.
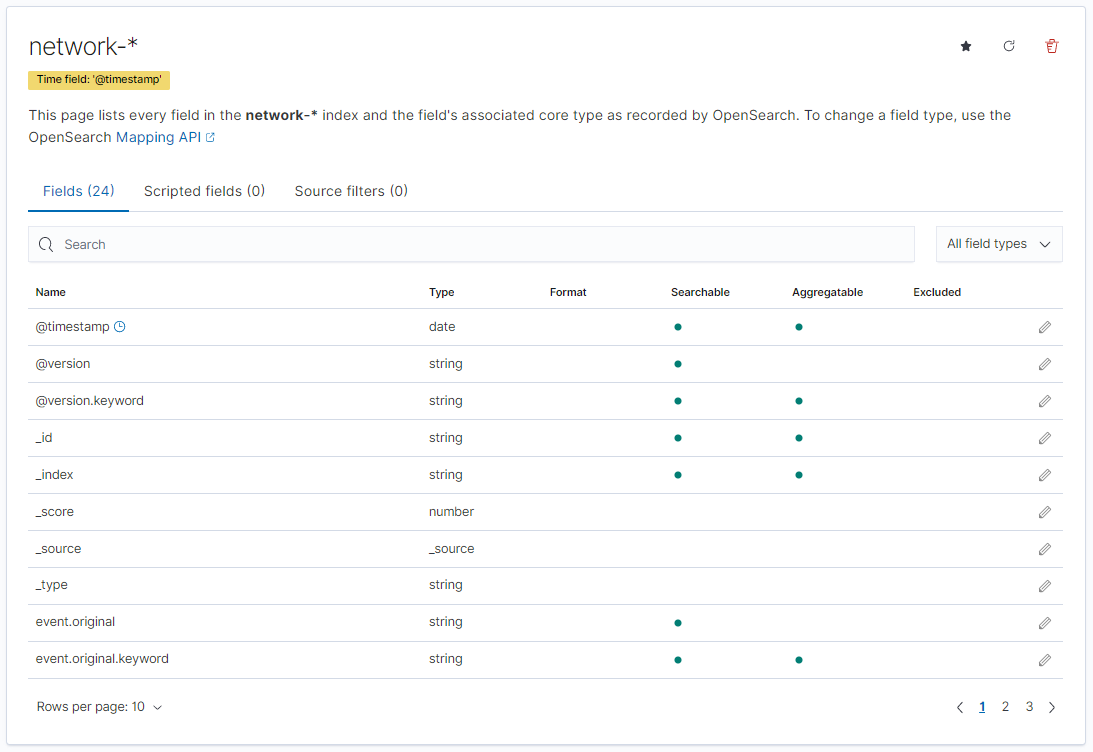
7. Click the * icon on the upper right hand corner of the page to set this as the default index.
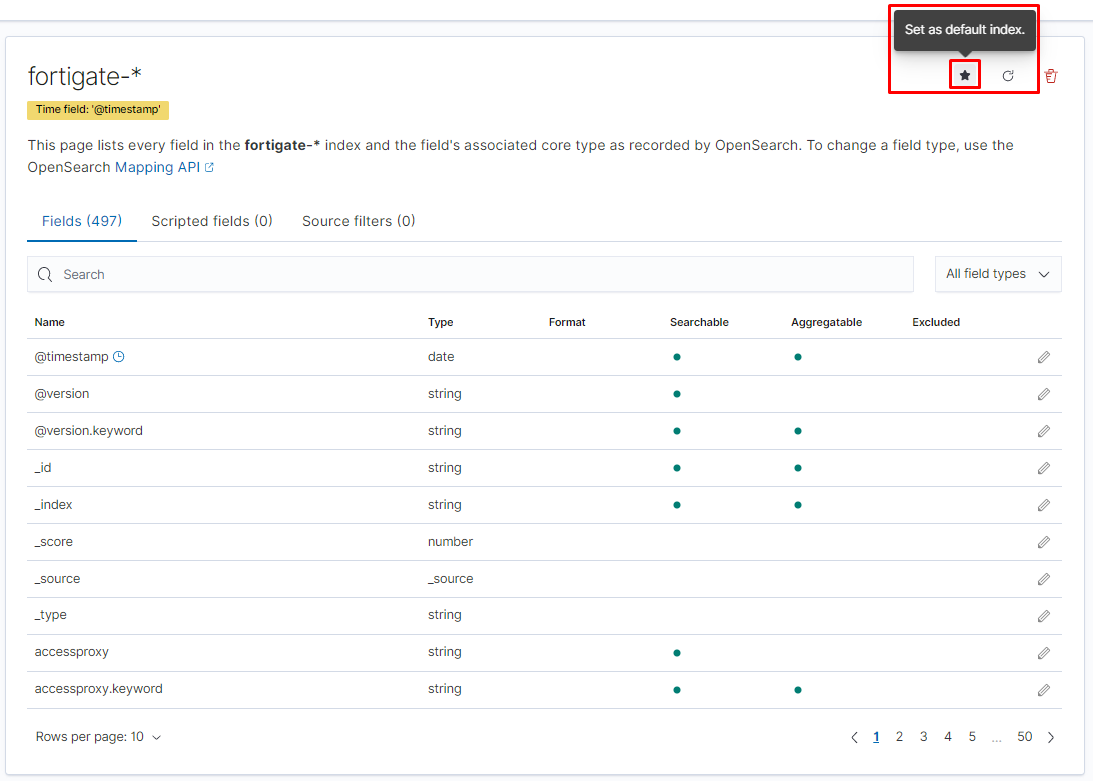
Note: If the newly created index is the only Index, by default it will be selected as the default index.
¶ Object templates
An object template is a way to tell blësk ELM how to feed up an index with graph and visualisation when it is created. Object templates let you initialize new index with predefined mappings and settings. For example, if you continuously index log data, you can define an index template so that all of these indexes have the same number of shards and replicas. Object templates are configured after index creation. When an index is created - either manually or through indexing a document - the collected logs are used as a basis for creating the object.
For user convenience, object templates are available to download and can be added to ELM as the following:
- Click on the main menu from the top left hand corner of the screen

2. At the bottom part of the menu bar, click Stack Management under the Management section
3. On the Stack Management page, click Saved Objects
4. On the Saved Objects page, click Import from the toolbar.
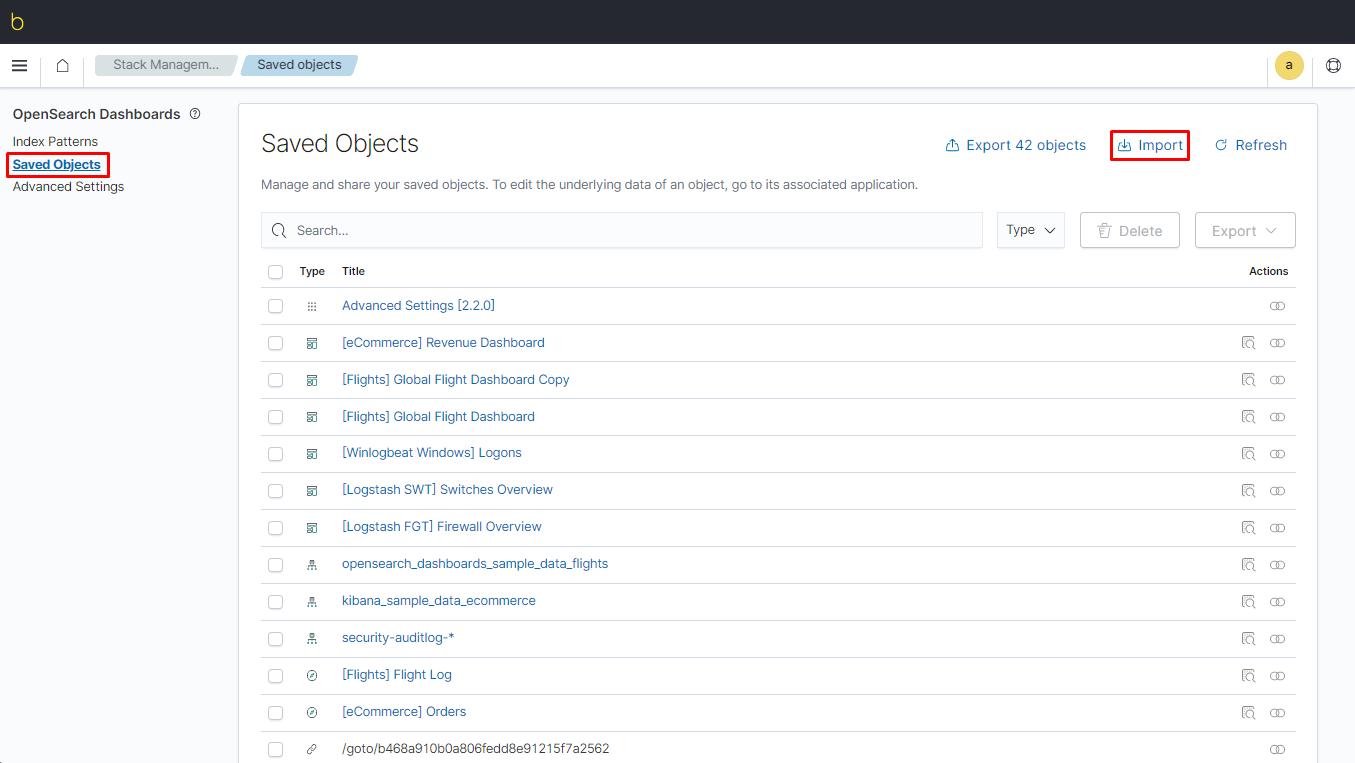
5. in the Import saved objects box, browse the file or just drag and drop the file into the Import box
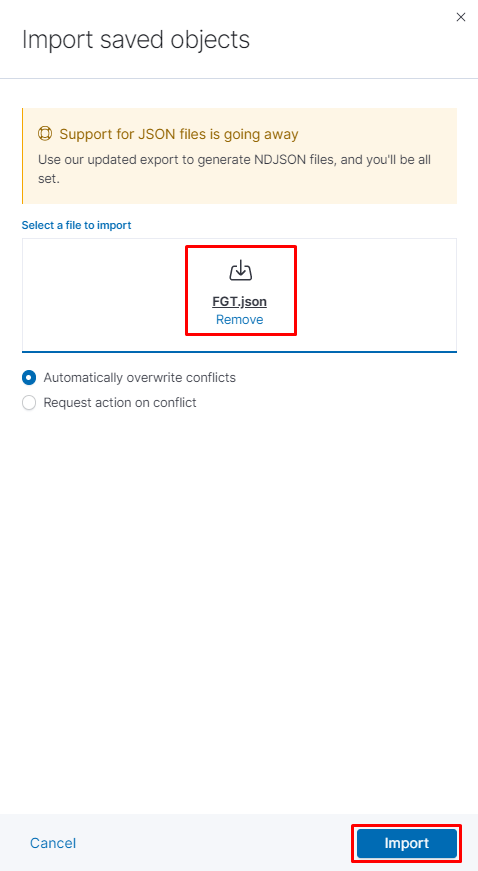
6. Click Import to complete importing the template file.
Download the ELM Index templates from the links below:
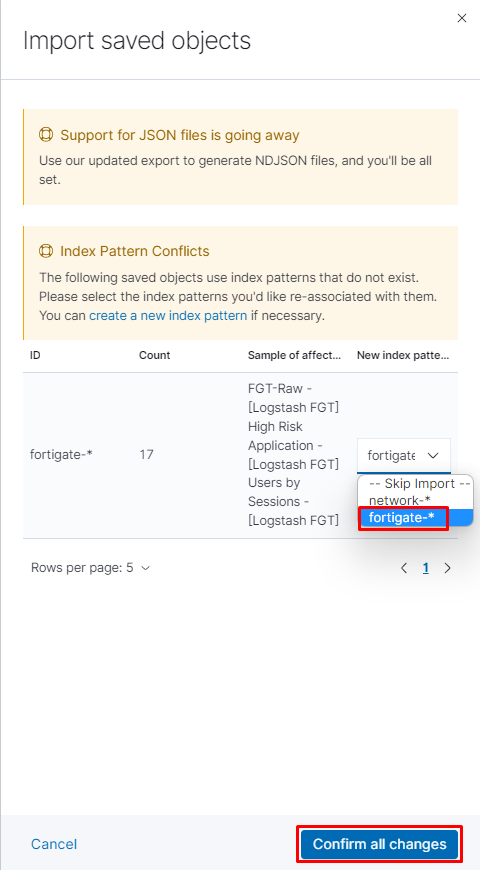
7. Once the import is completed, select the right index pattern from the New index pattern dropdown box and click Confirm all changes.
¶ Discover
- Open the main menu, then click Discover.
- Data from the newly created Index pattern is now accessible on this page.
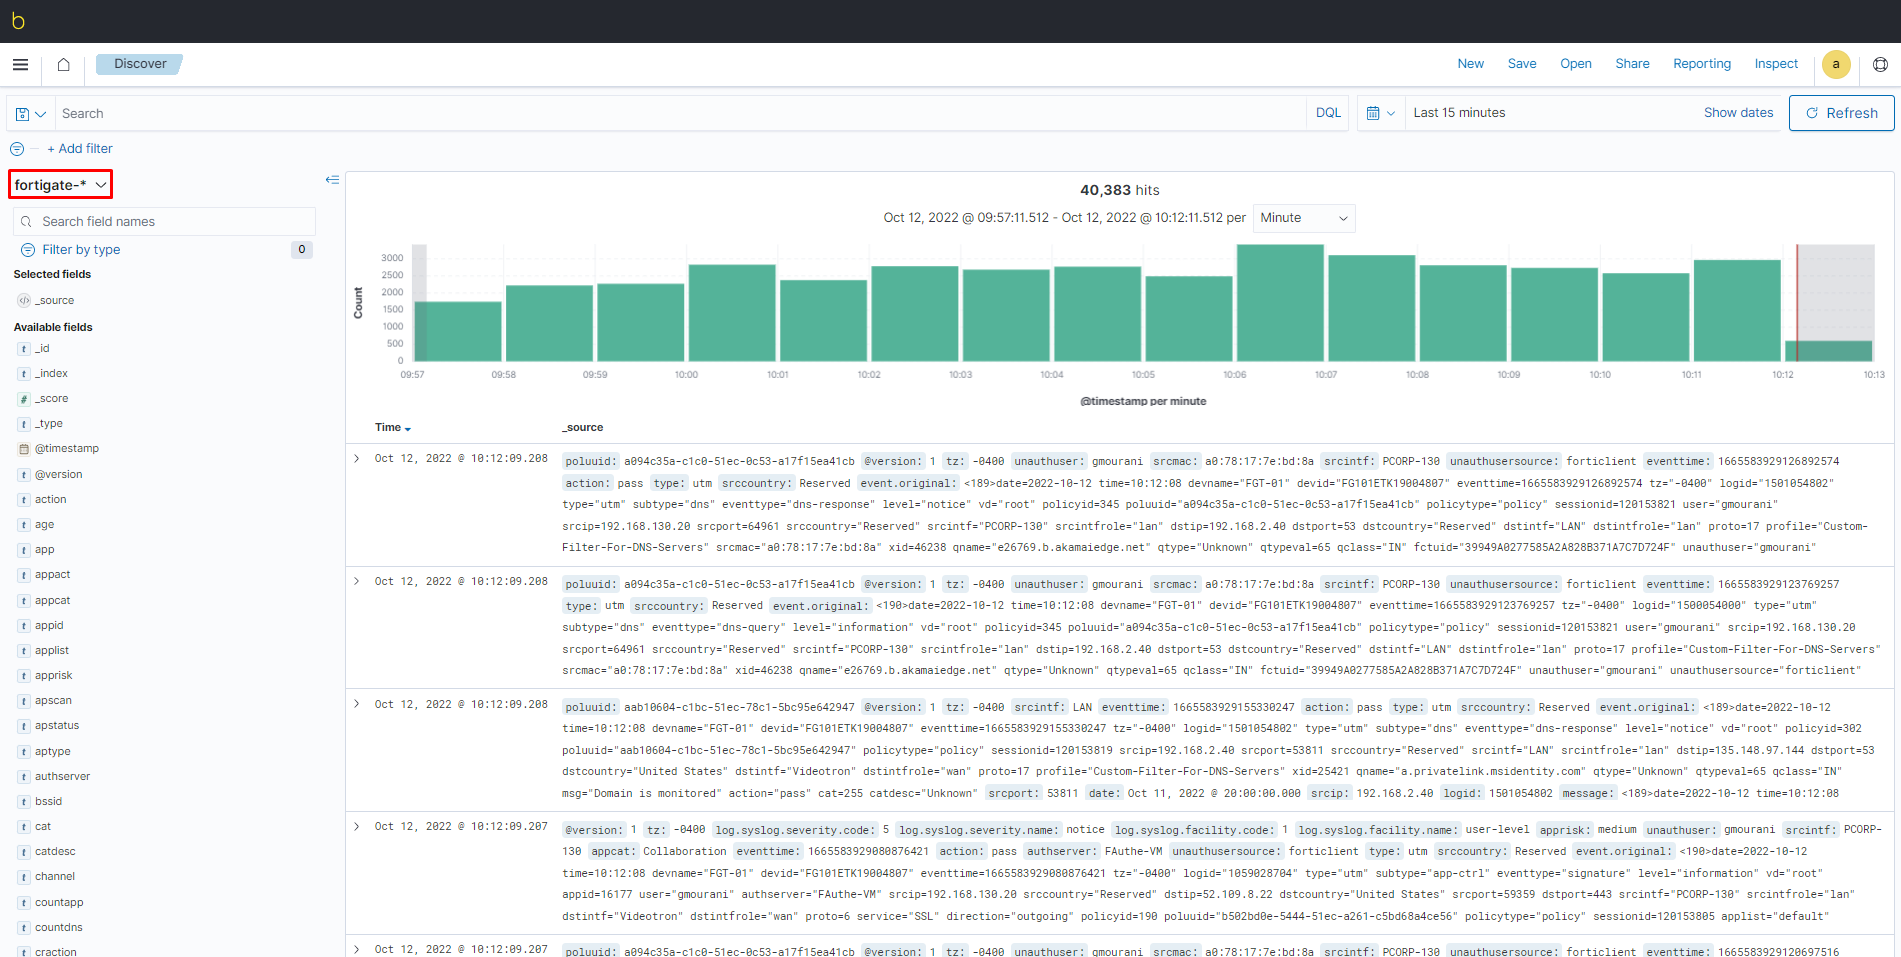
3. Use the search box to type a search keyword. Wildcards “*” queries can be used to search by a term prefix or to search multiple fields.