¶ Introduction
This document explains how to create automated graph reports with the blësk NPM module. Automated graph reports can be sent via email at predetermined intervals. This will allow you to focus on graphs that count the most and will help to avoid the need to search the graphs in NPM when an analysis is required.

There is also a video tutorial available here: NPM Add Graph Tutorial
¶ Create a new Automated Report
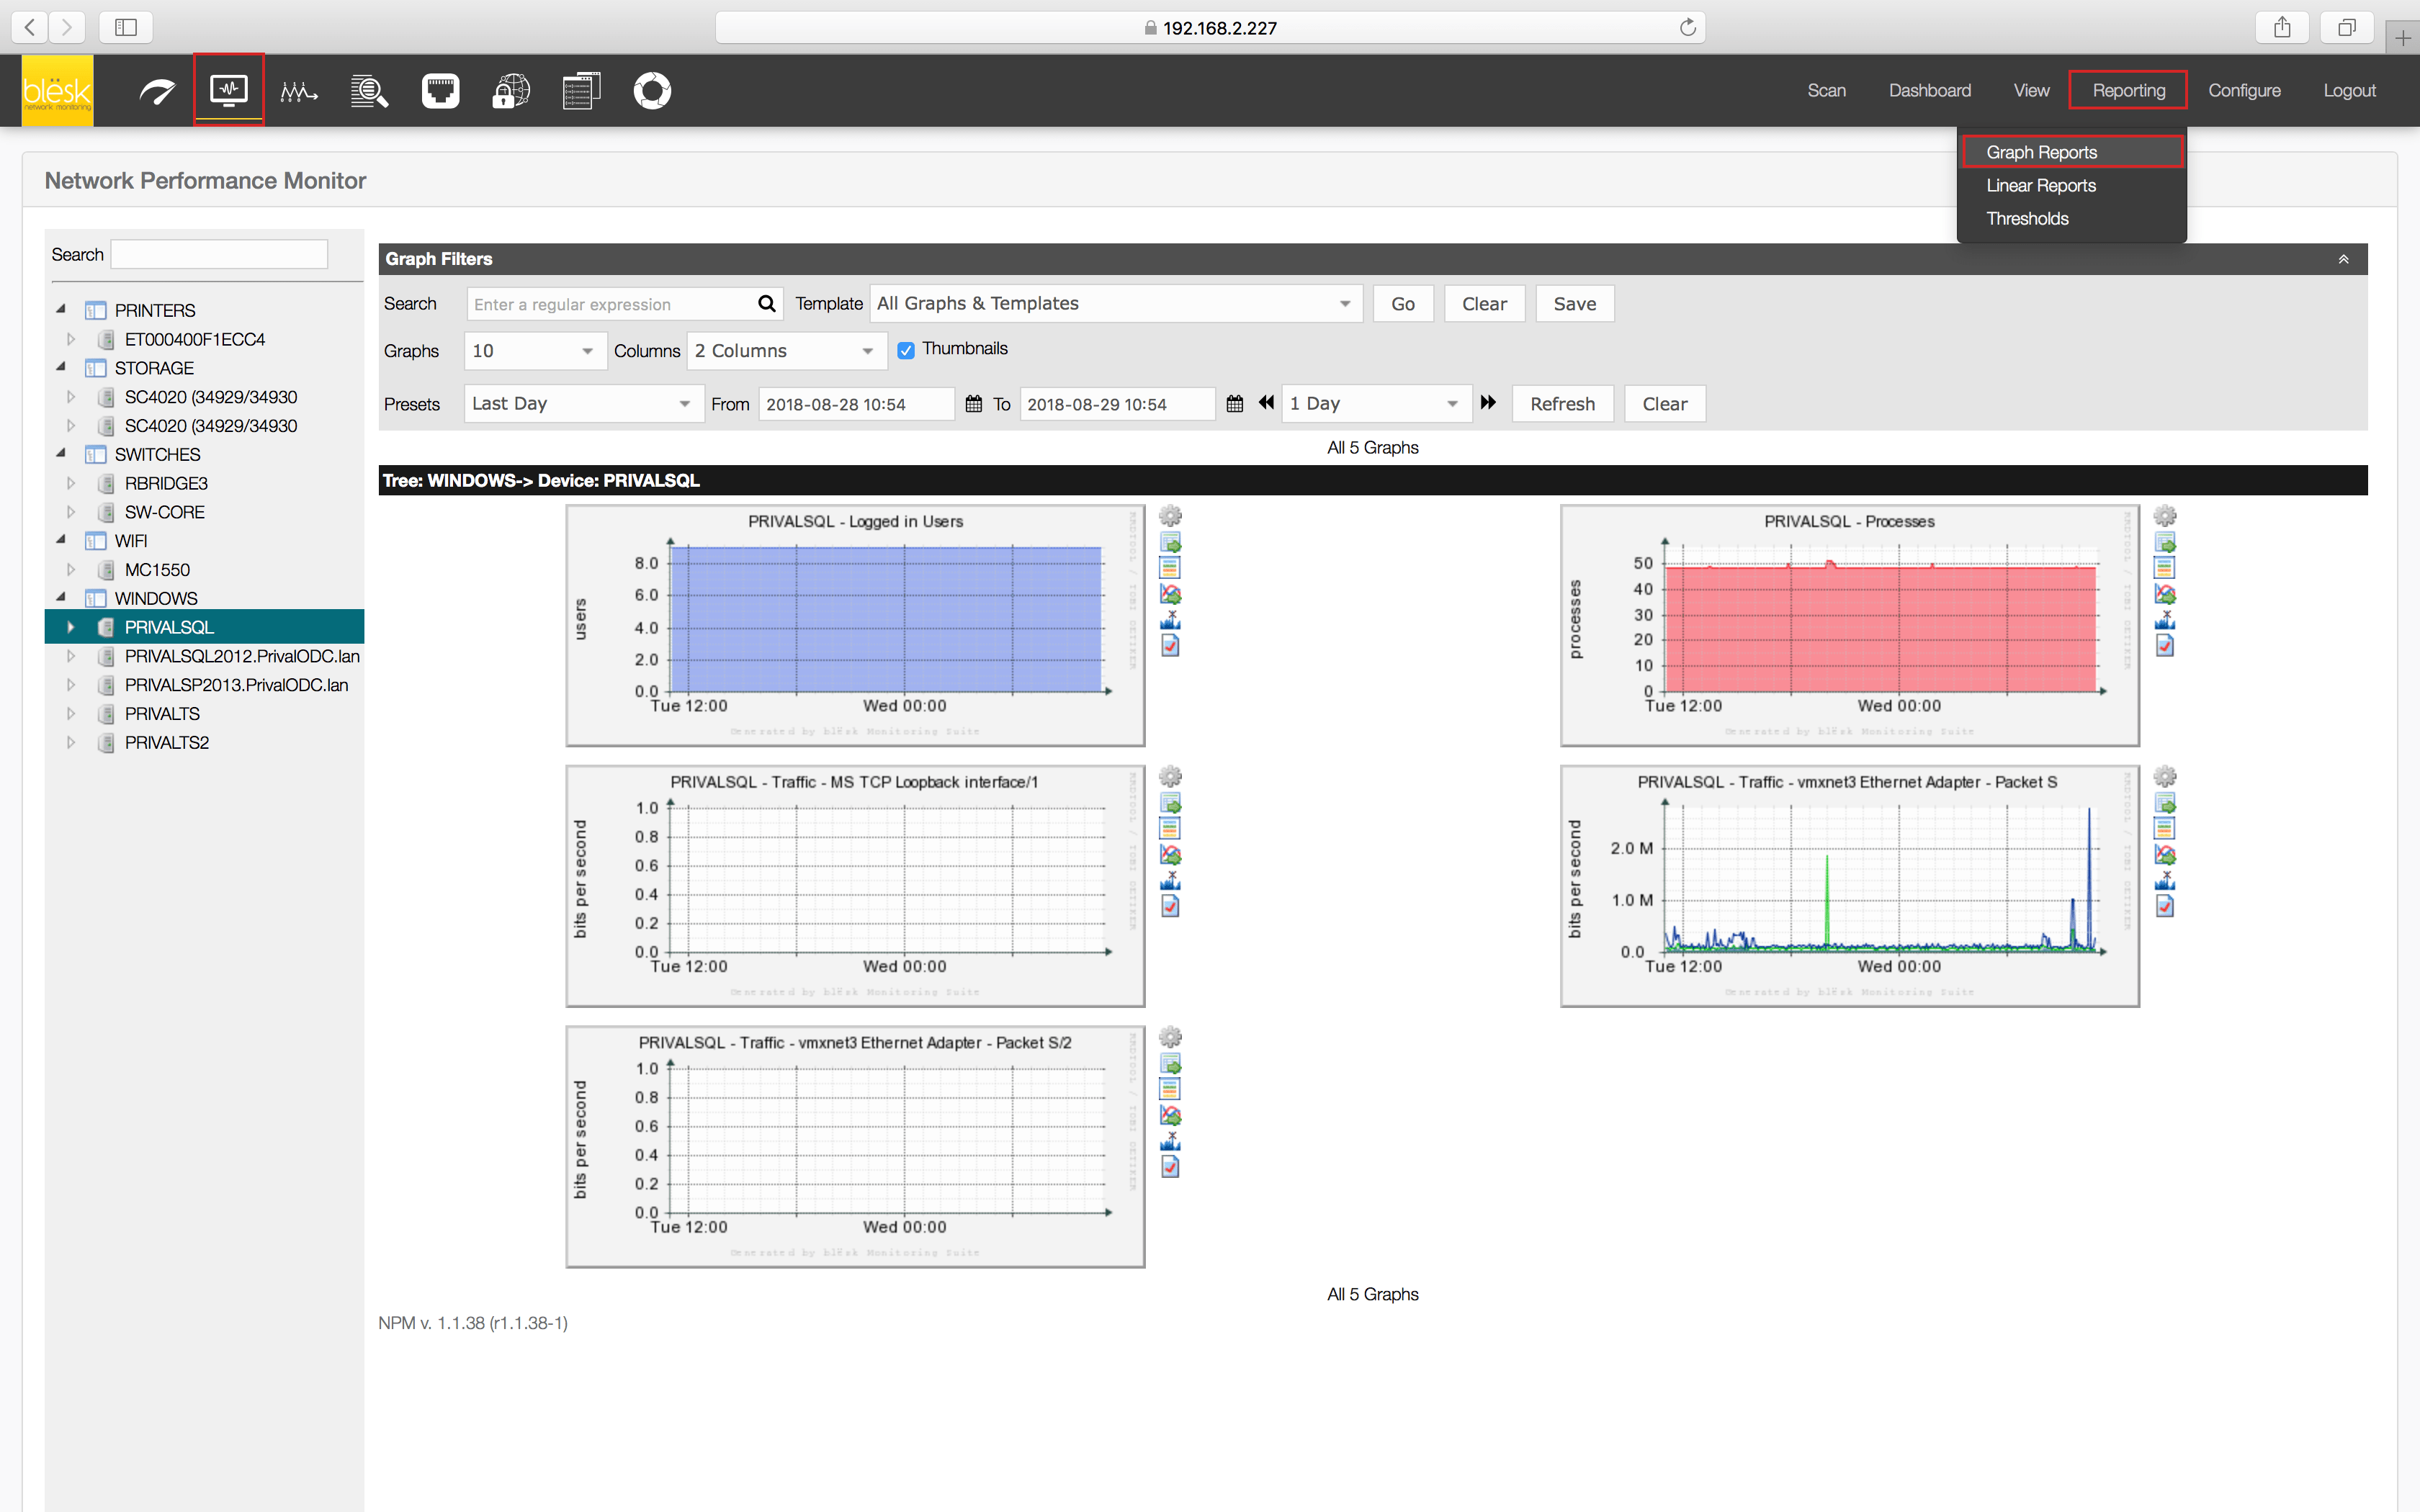
From the Reporting page, click the “+” link to create a new report.

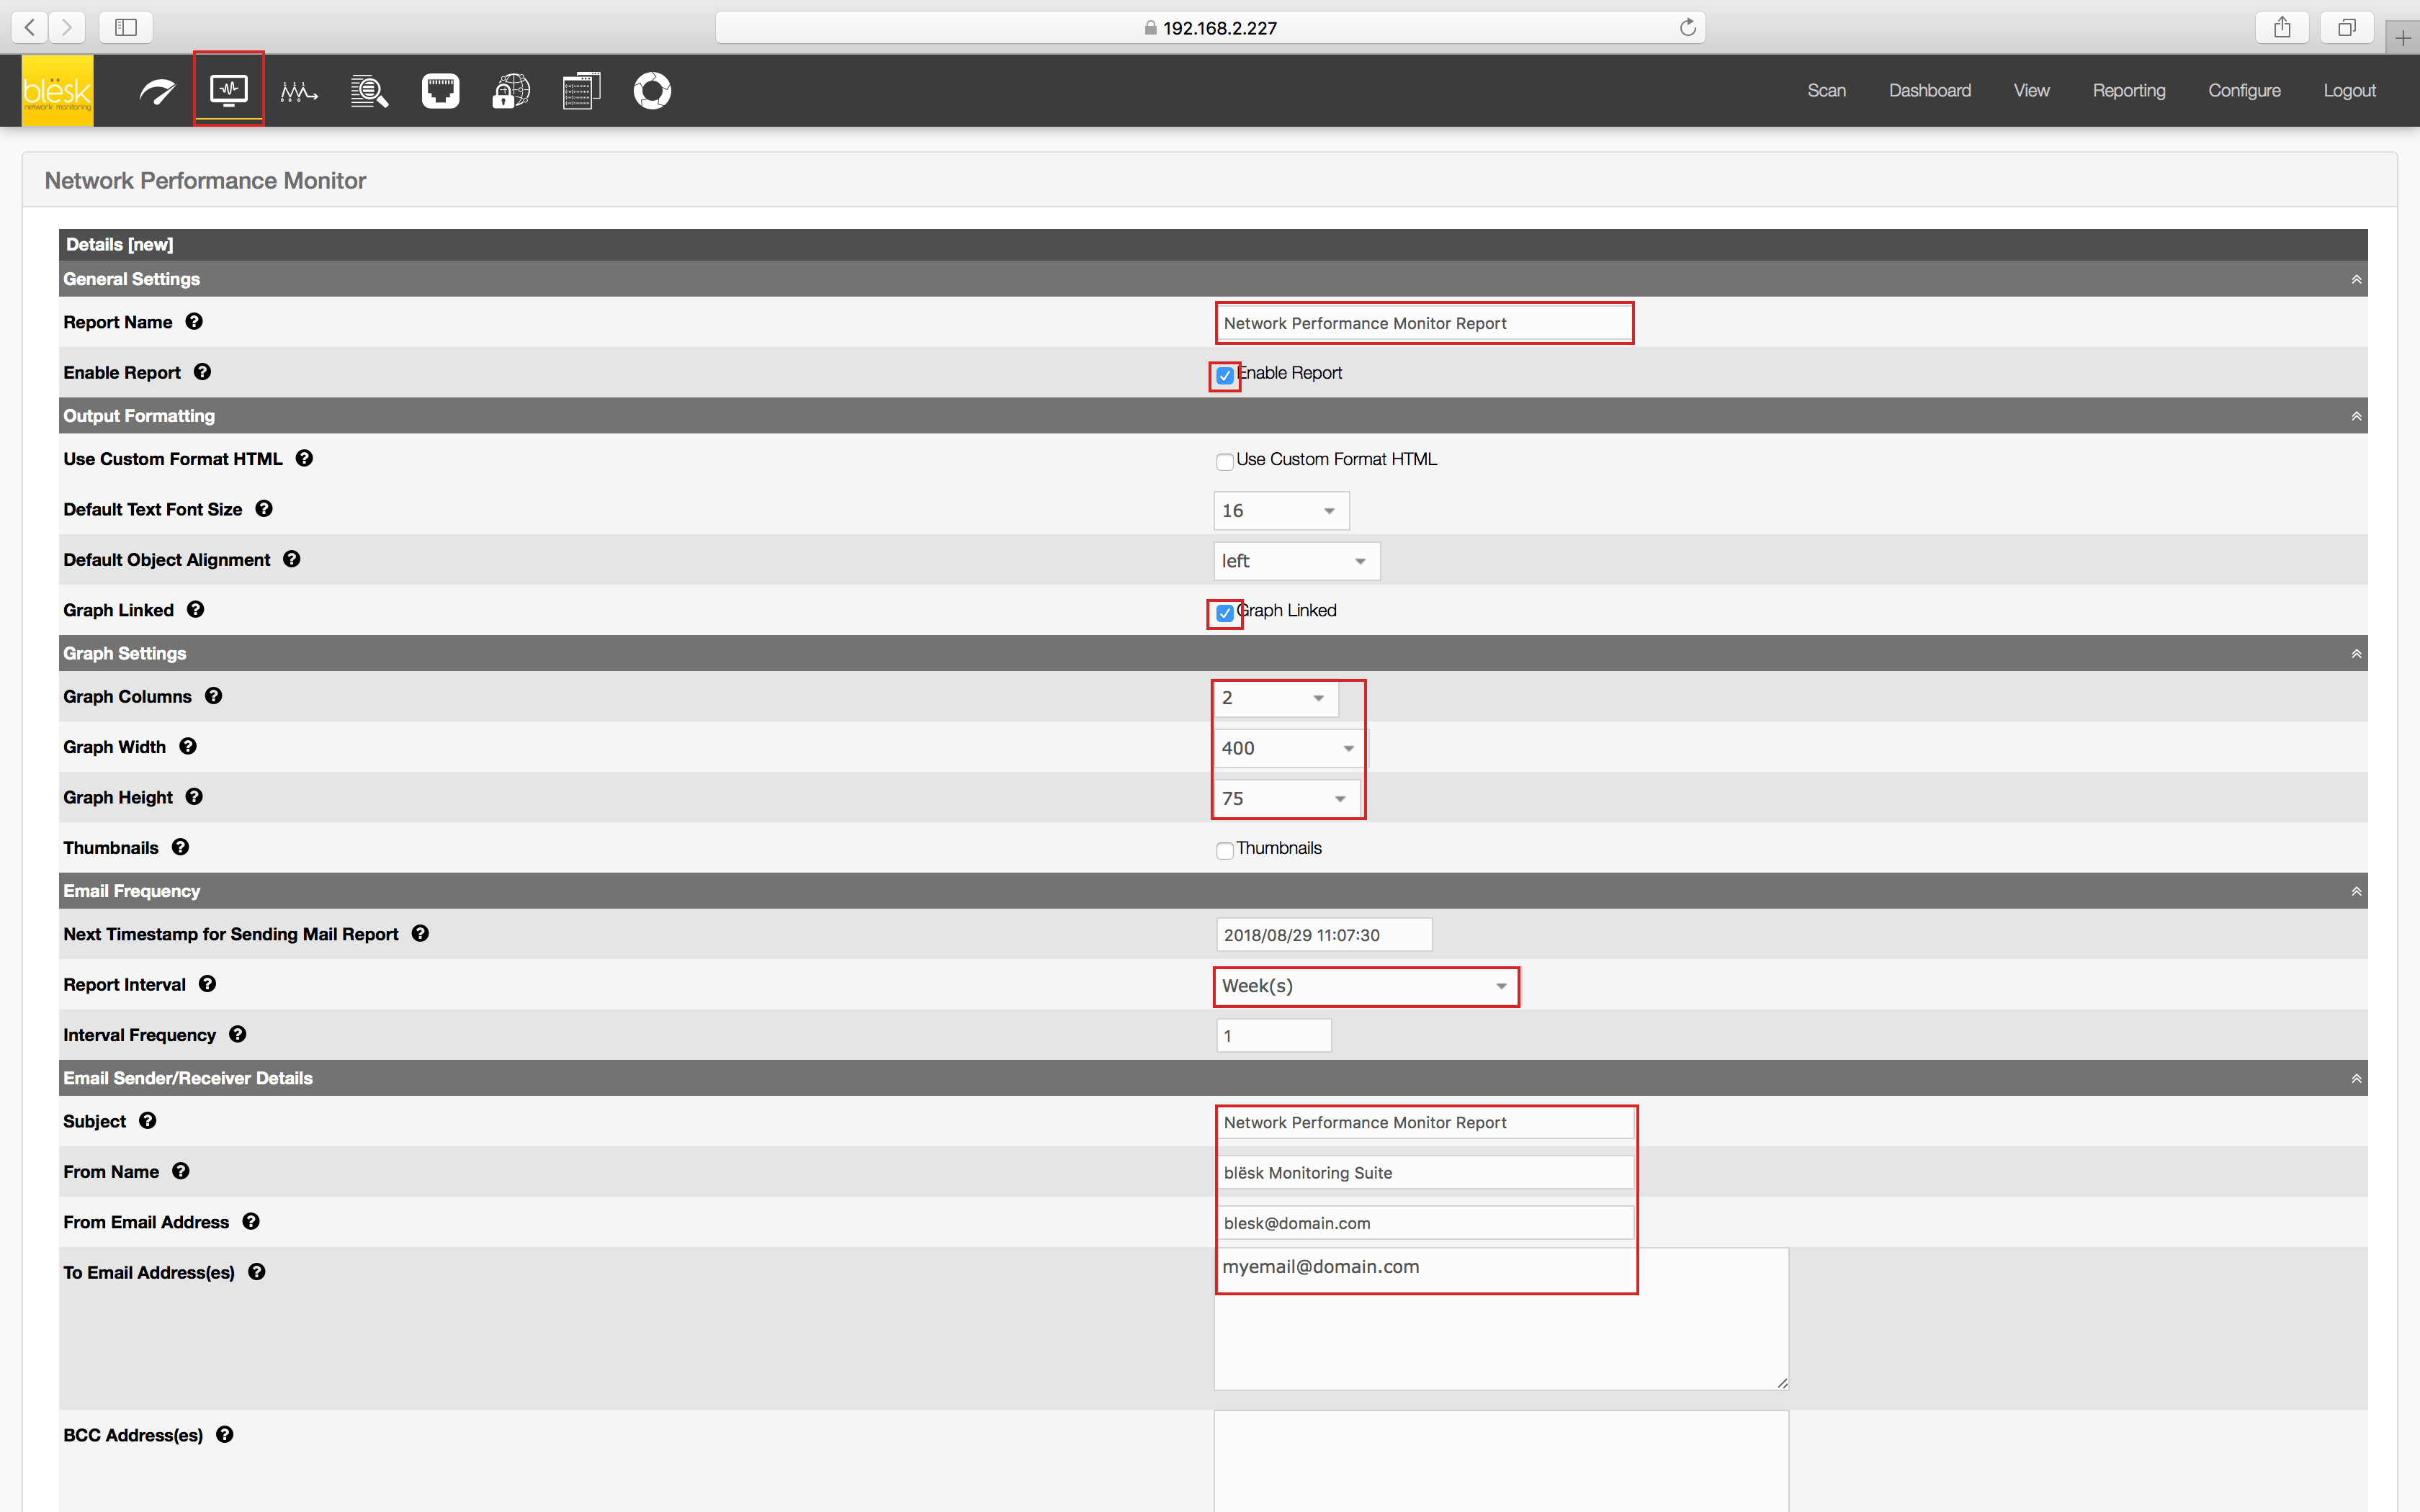
This will present you with the new Report Details screen where you will have to fill out general information regarding the new automated report you wish to create. The most important information is bordered in red.

¶ Add Items to your report
Now that your automated report is created, you need to add items. Items represent the graphs that are available in NPM. Click the “Items” tab, then the “+” link to display the screen from where you can add a new graph.

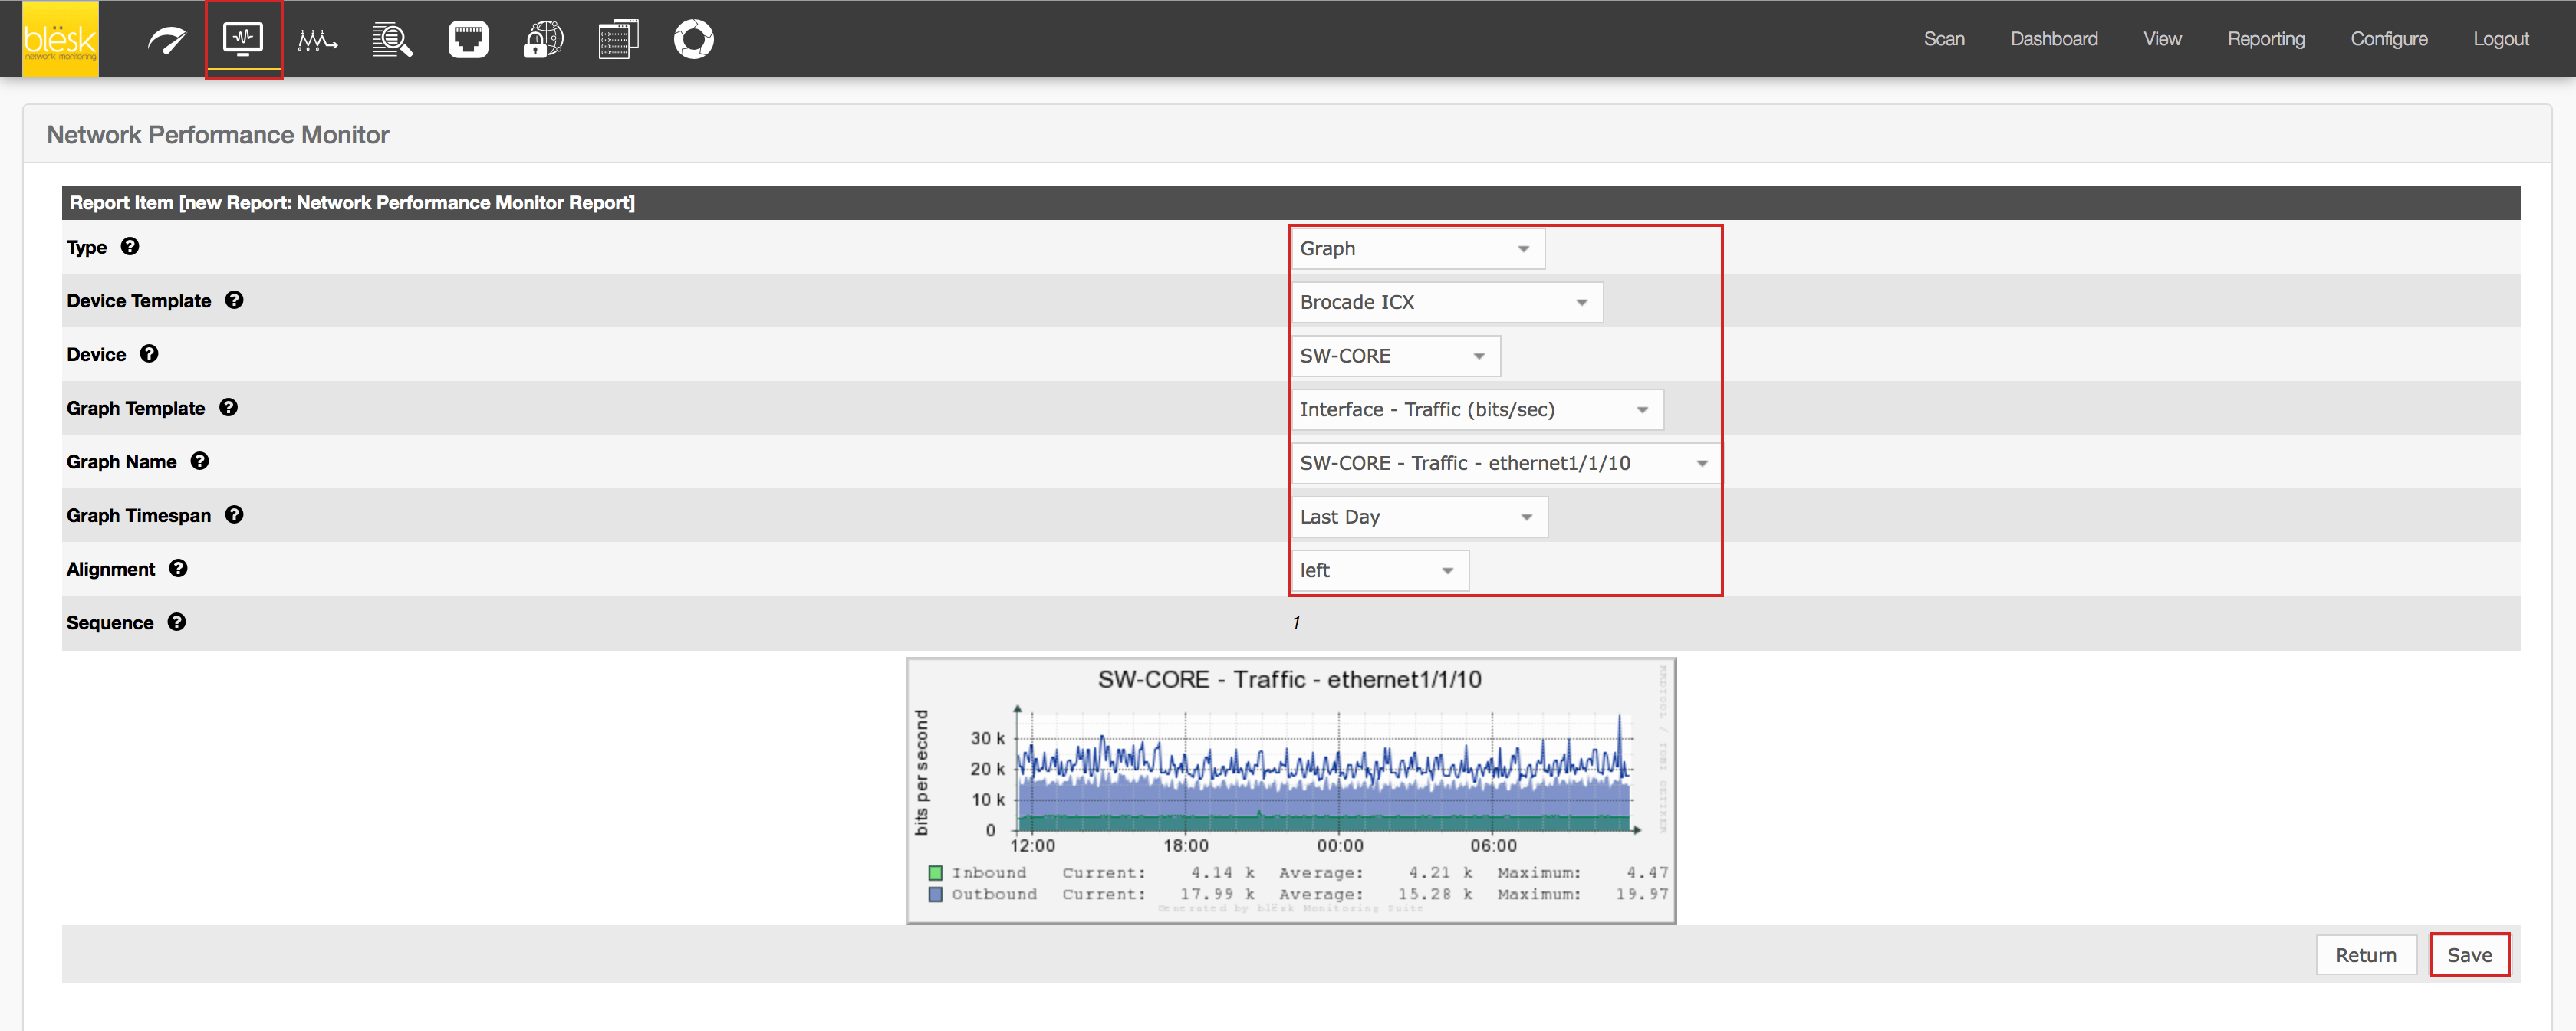
Depending on your selection of the item ‘Type’ to be added, the list of available options will be adjusted. Usually, you will want to add a ‘Graph’ item from a specific ‘Device Template’ for a precise ‘Device’ between the predefined time period ‘Graph Timespan’. Below is an example of how it should appear.

Repeat the above procedure for any additional graphs you wish to add to your automated report.