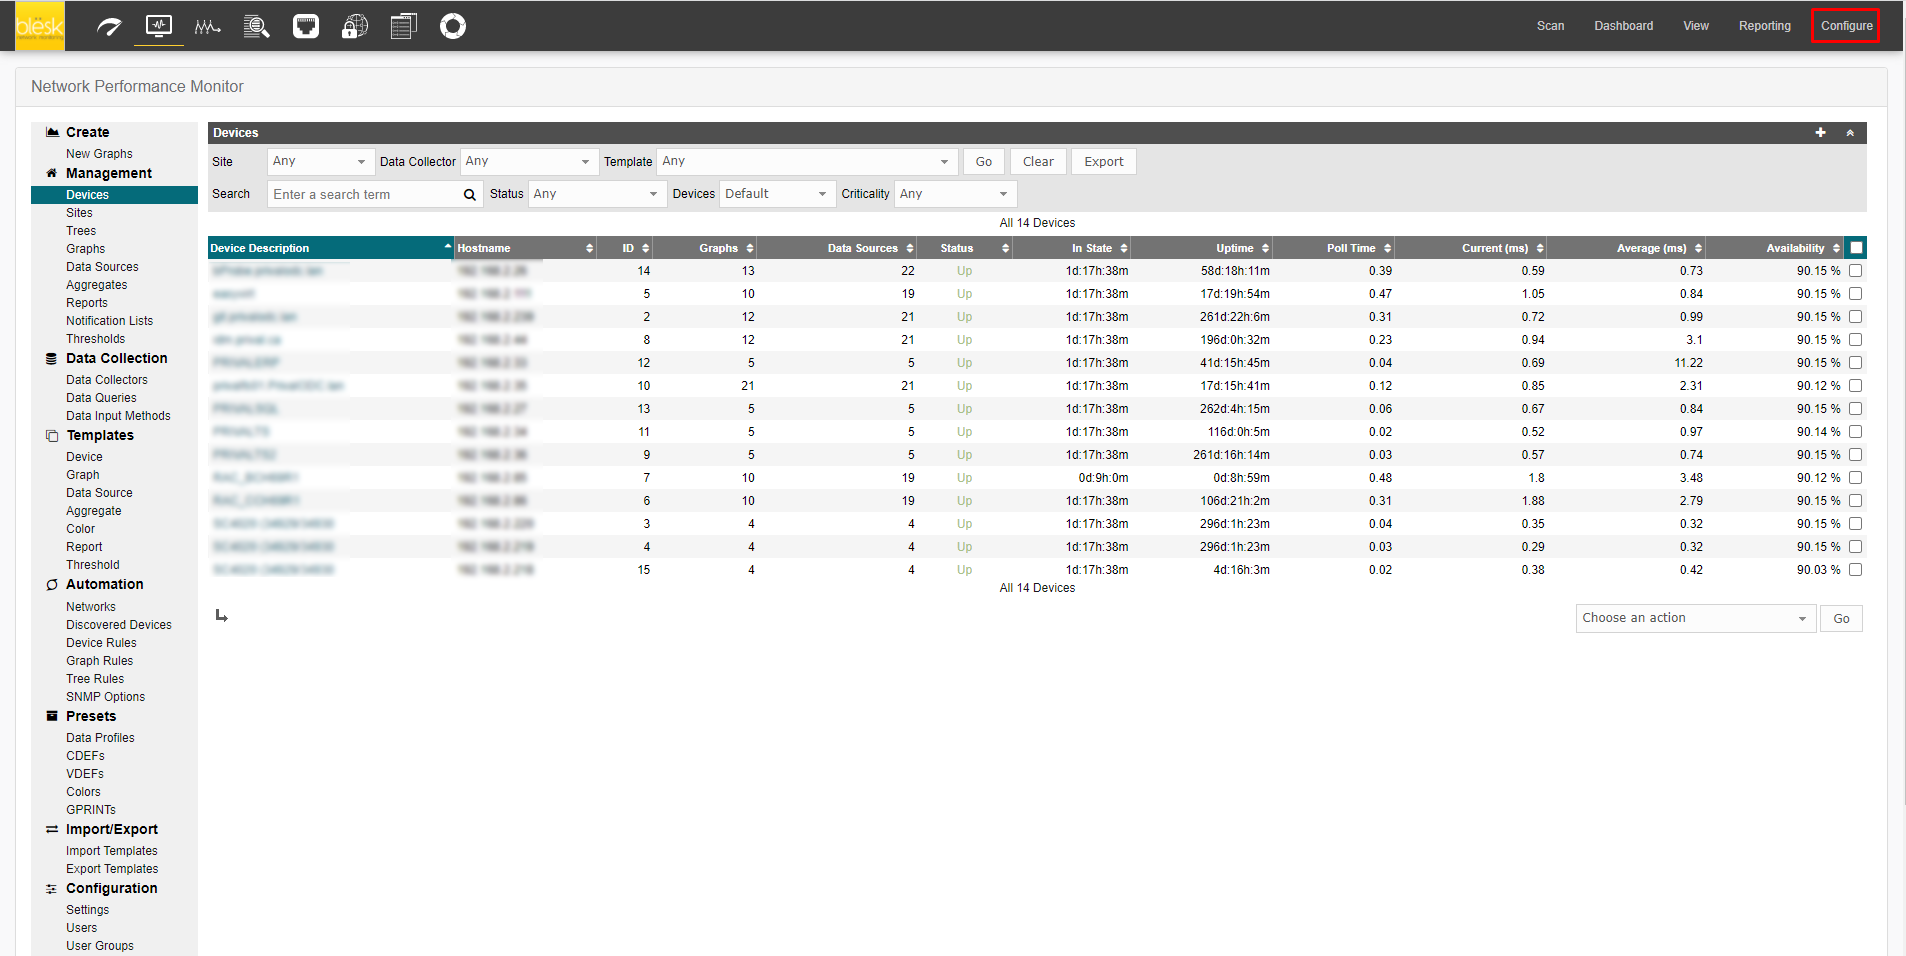
The Configure menu, which is highlighted in red, is for managing Network Performance Monitor. Clicking the Administration tab automatically brings you to the Devices page, which you can also find linked in the left-side Administration menu.
¶ Settings
This Settings option appears in the left side menu of the Administration tab. It is not to be confused with the Settings link in the top right corner of NPM.
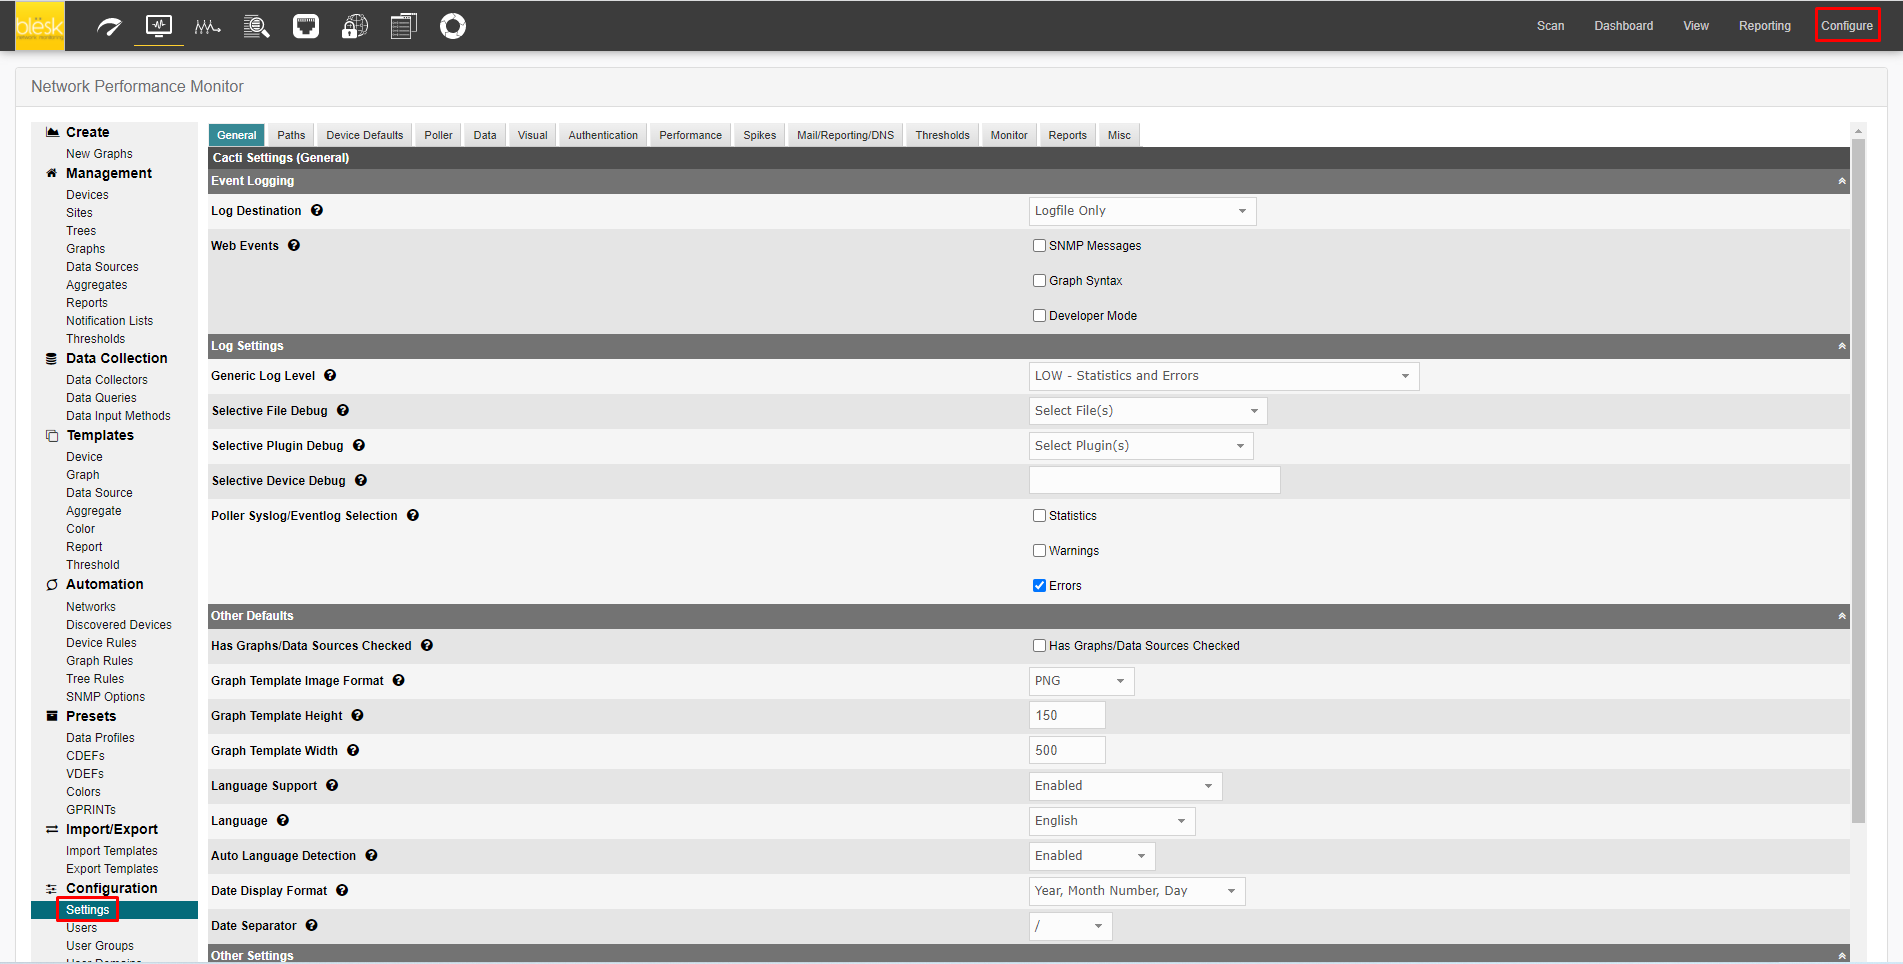
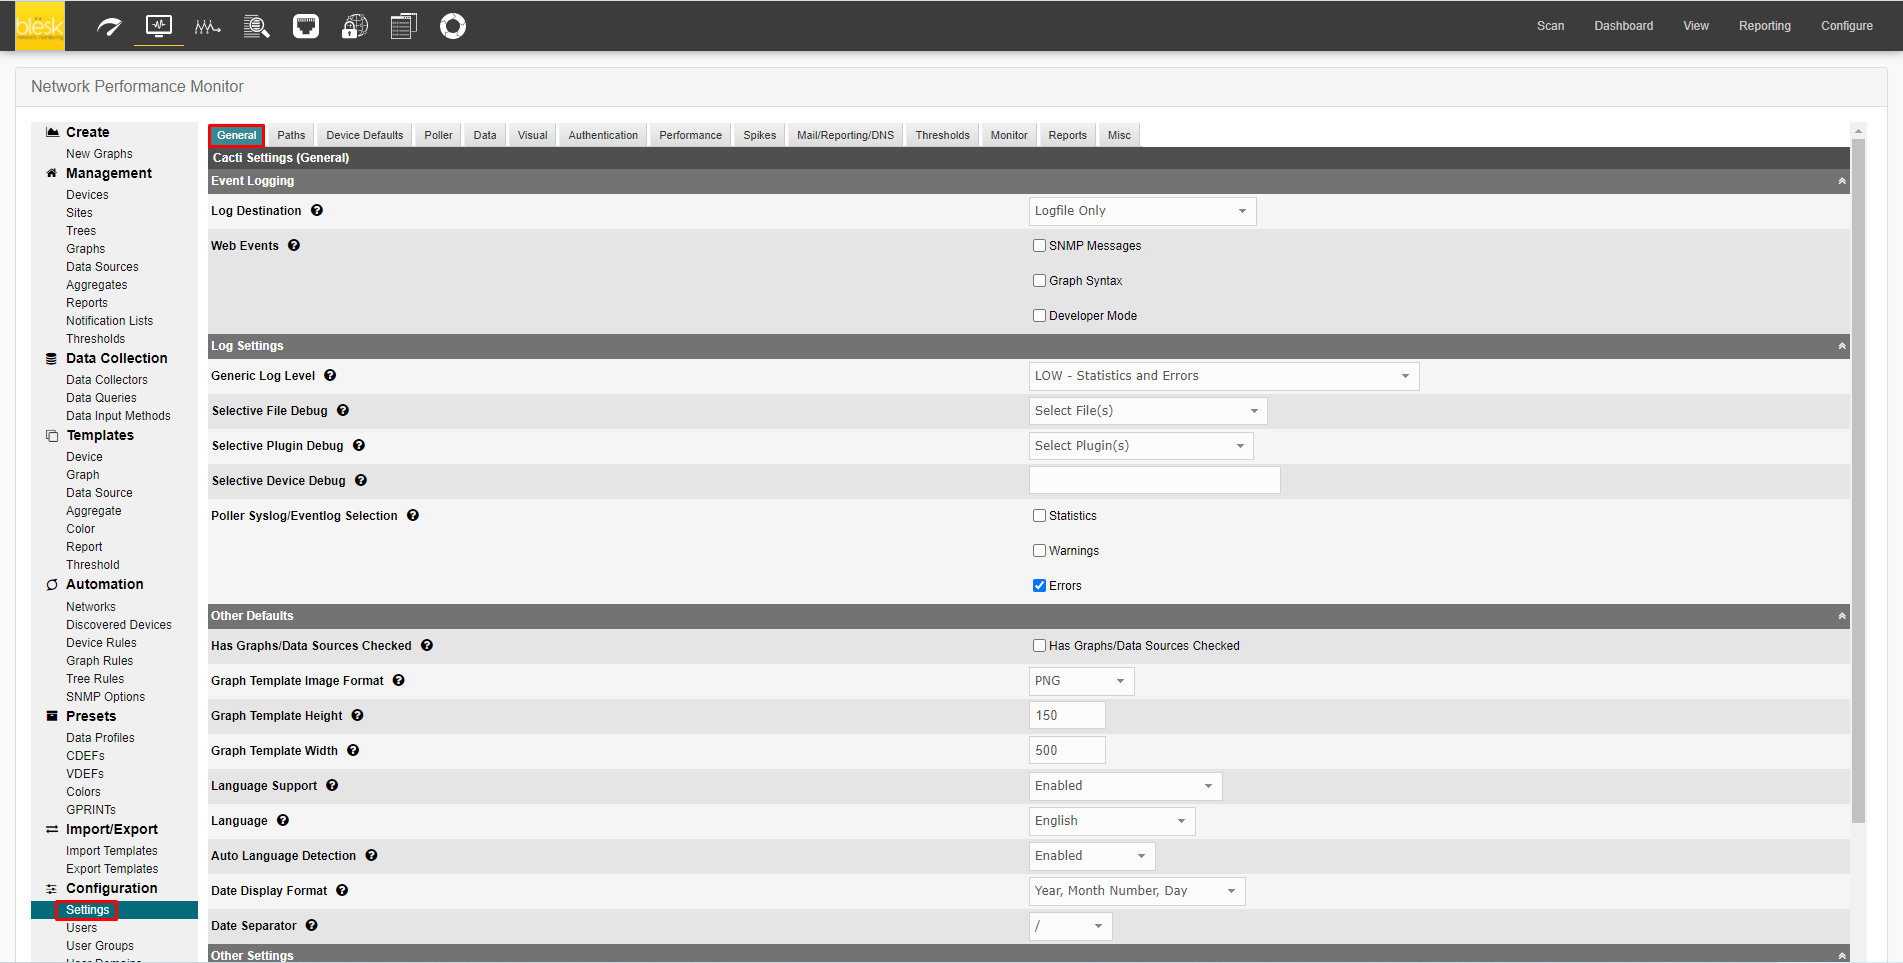
¶ General
Here you can configure such options as log management, poller settings, and SNMP settings.
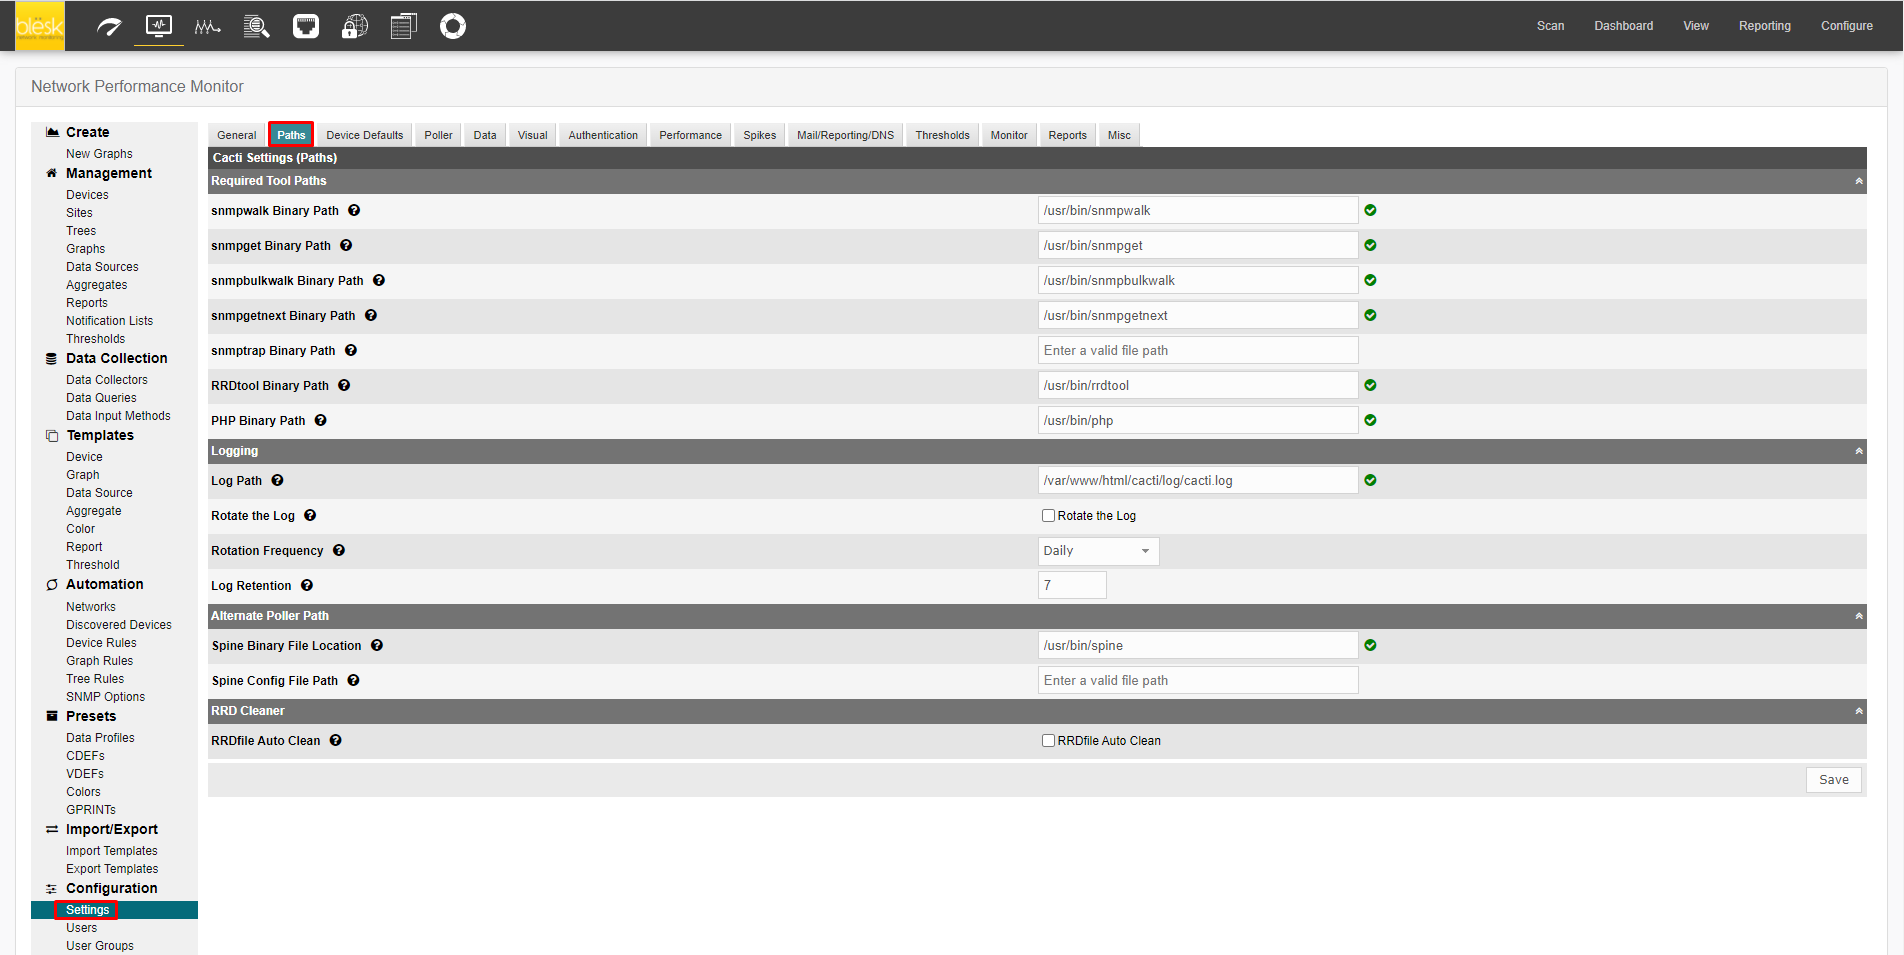
¶ Paths
The paths tab allows you to view and modify the system paths of various tools, the logs folder path, the Poller file path, and more. This information was collected during the installation of the software and you generally do not have to modify it.
¶ Poller
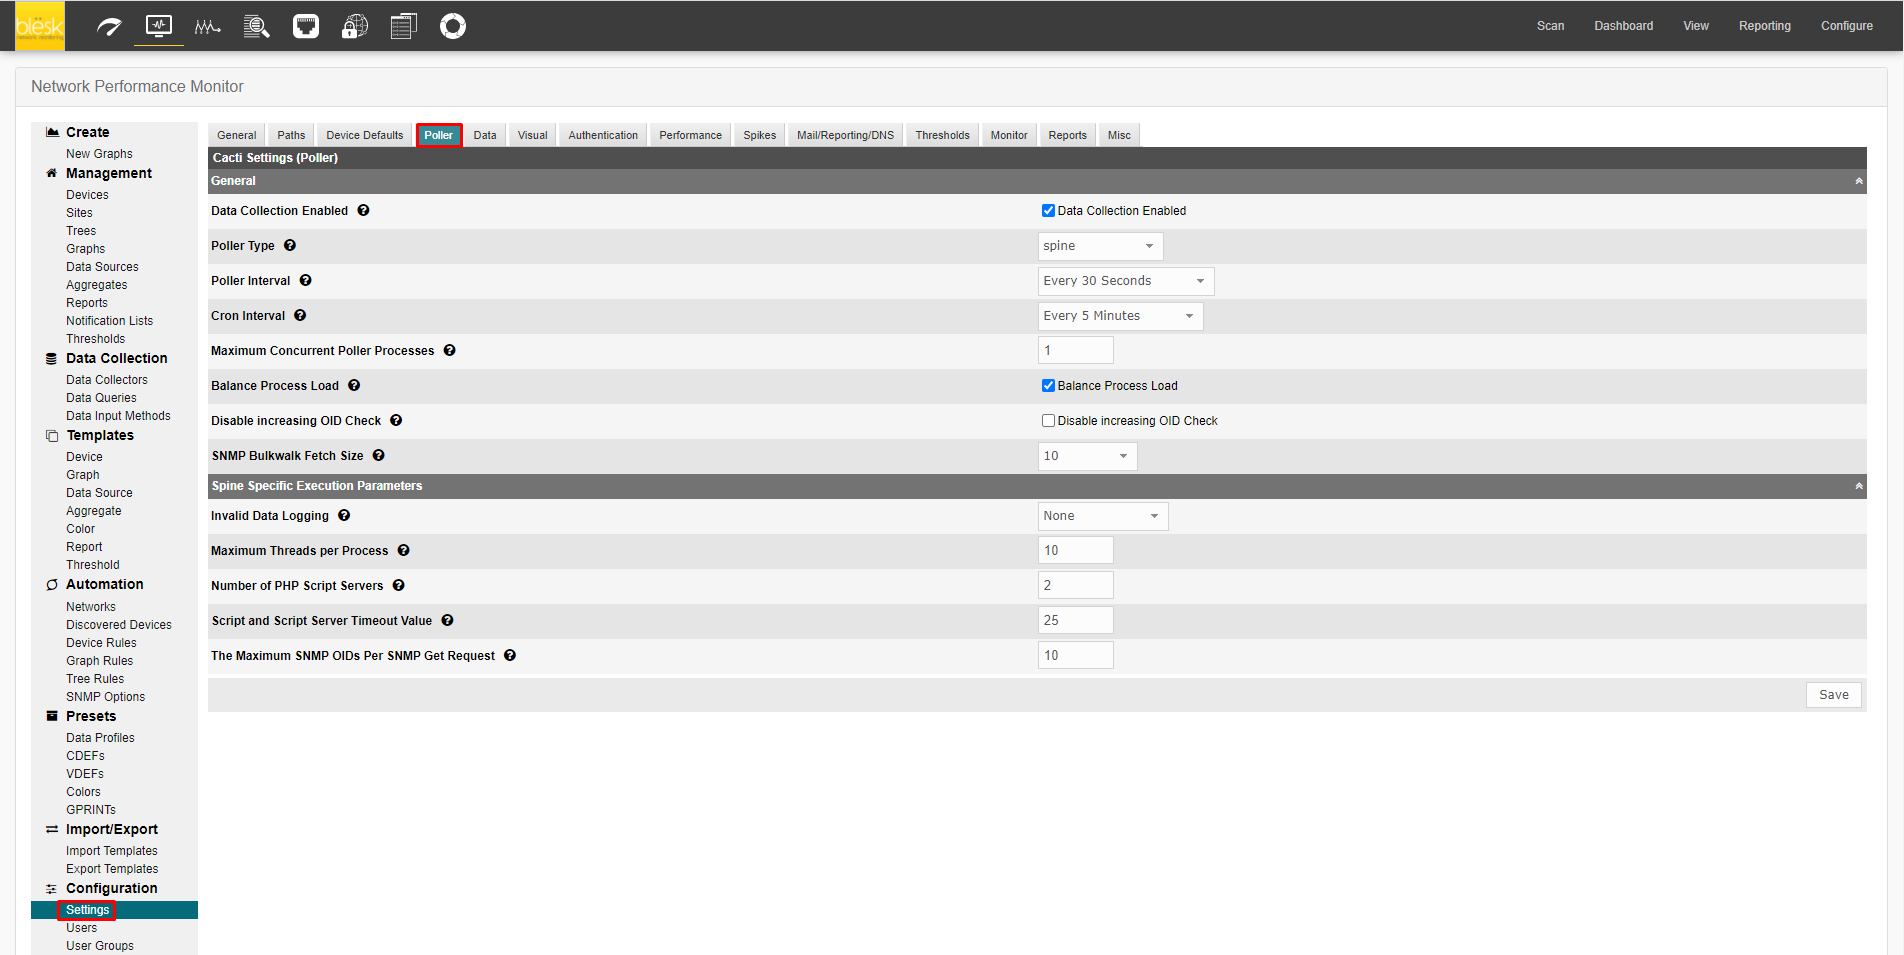
In this tab you can specify the poller settings, such as the type and polling interval. This information was collected during the installation of the software and you generally do not have to modify it.
¶ Visual
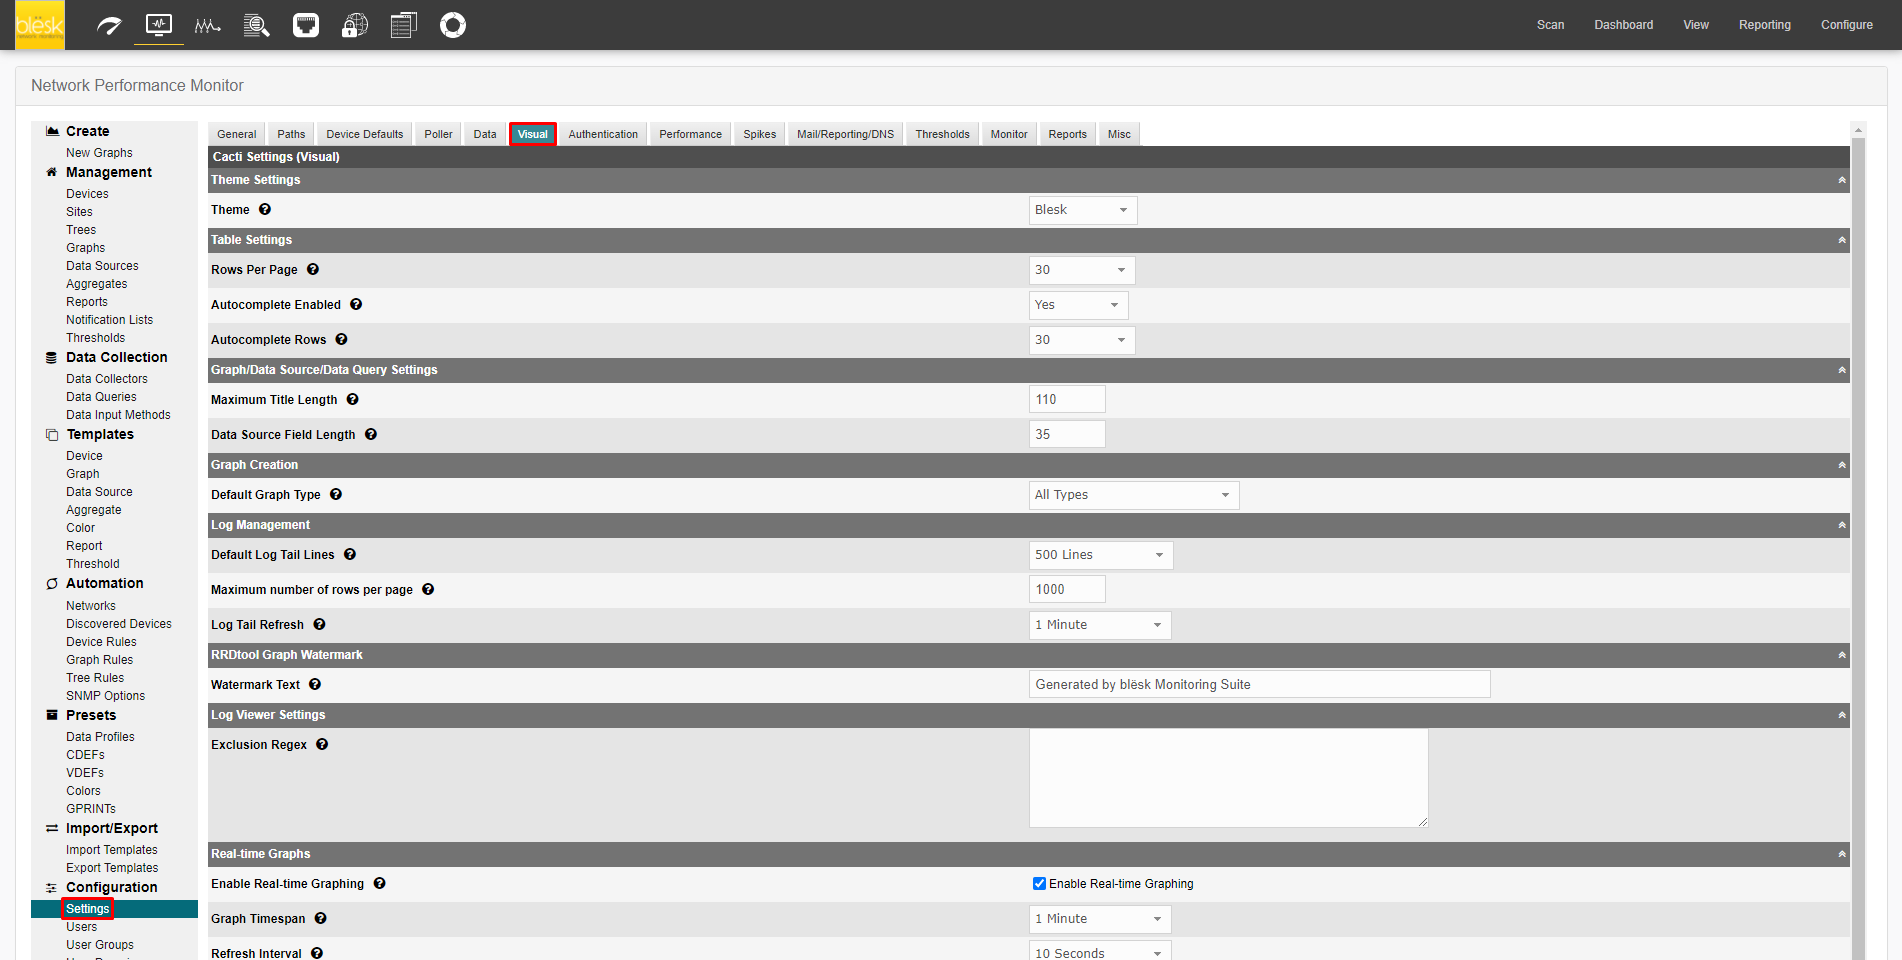
This tab allows you to change the visual appearance of NPM. Here you can modify the graph size, the number or graphs per page, the number of hosts per page, etc.
¶ Authentication
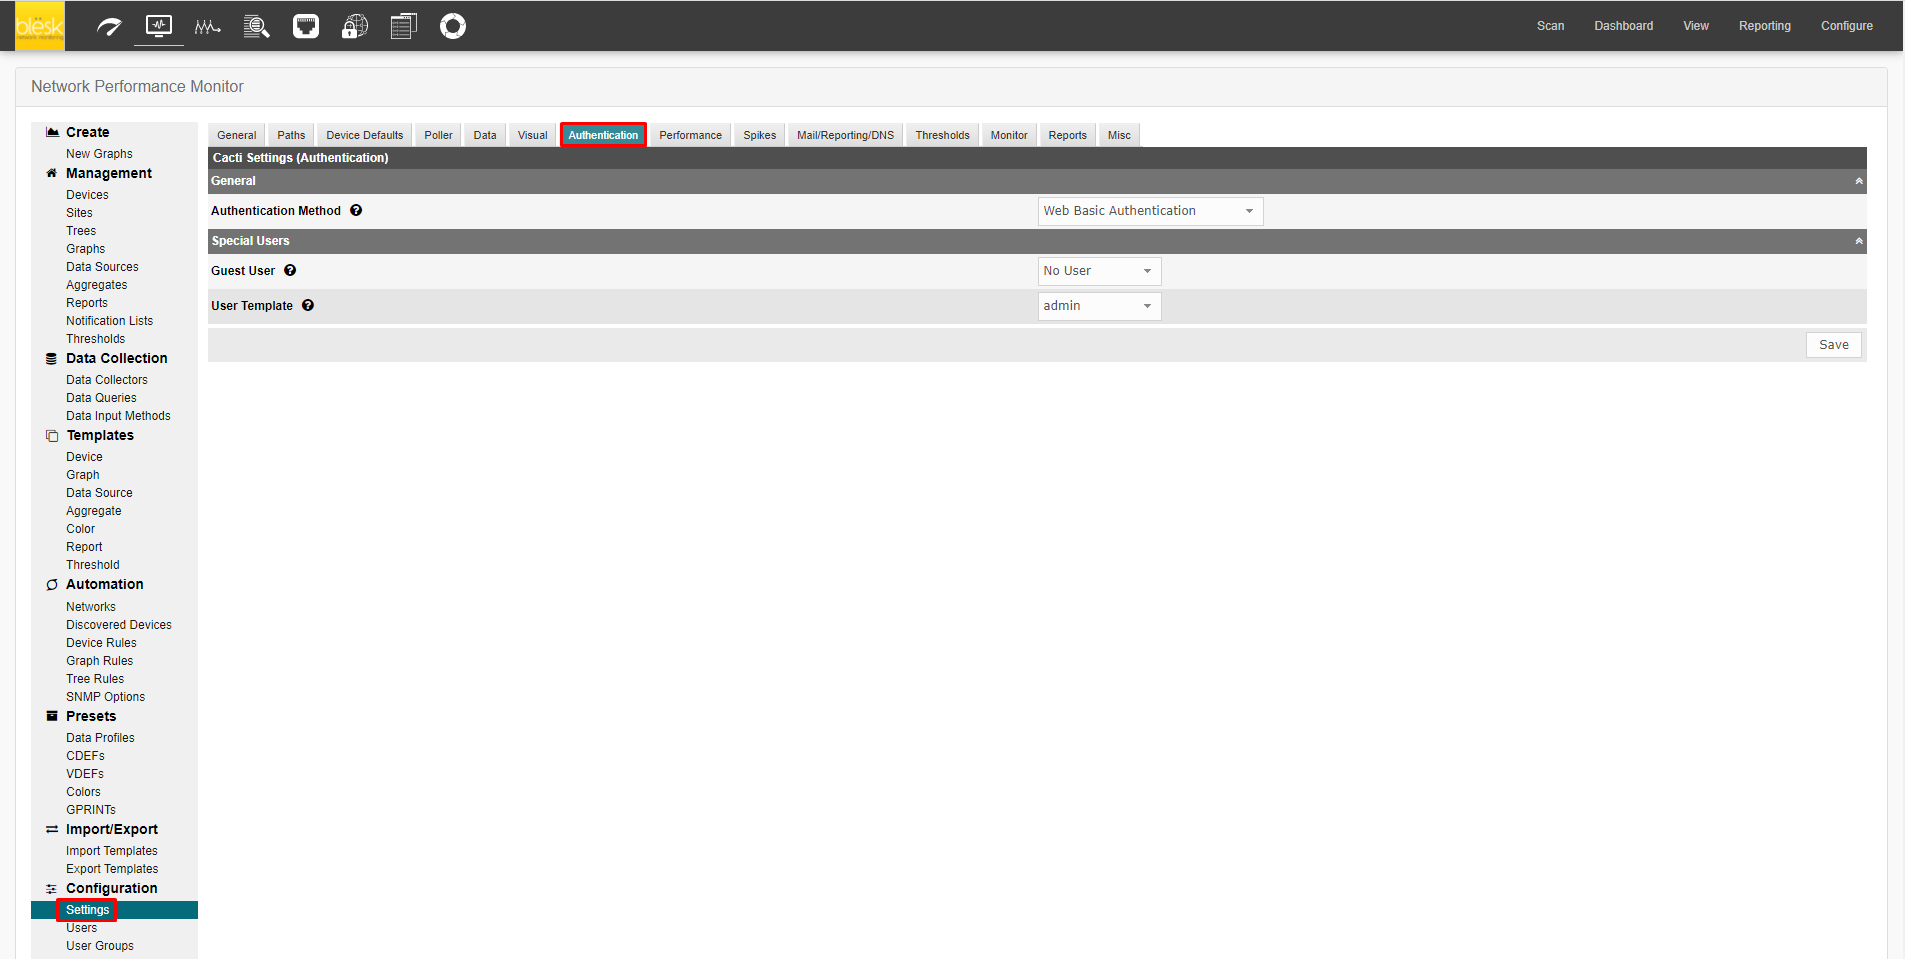
This is the page for setting up user permissions.
¶ Mail/Reporting/DNS
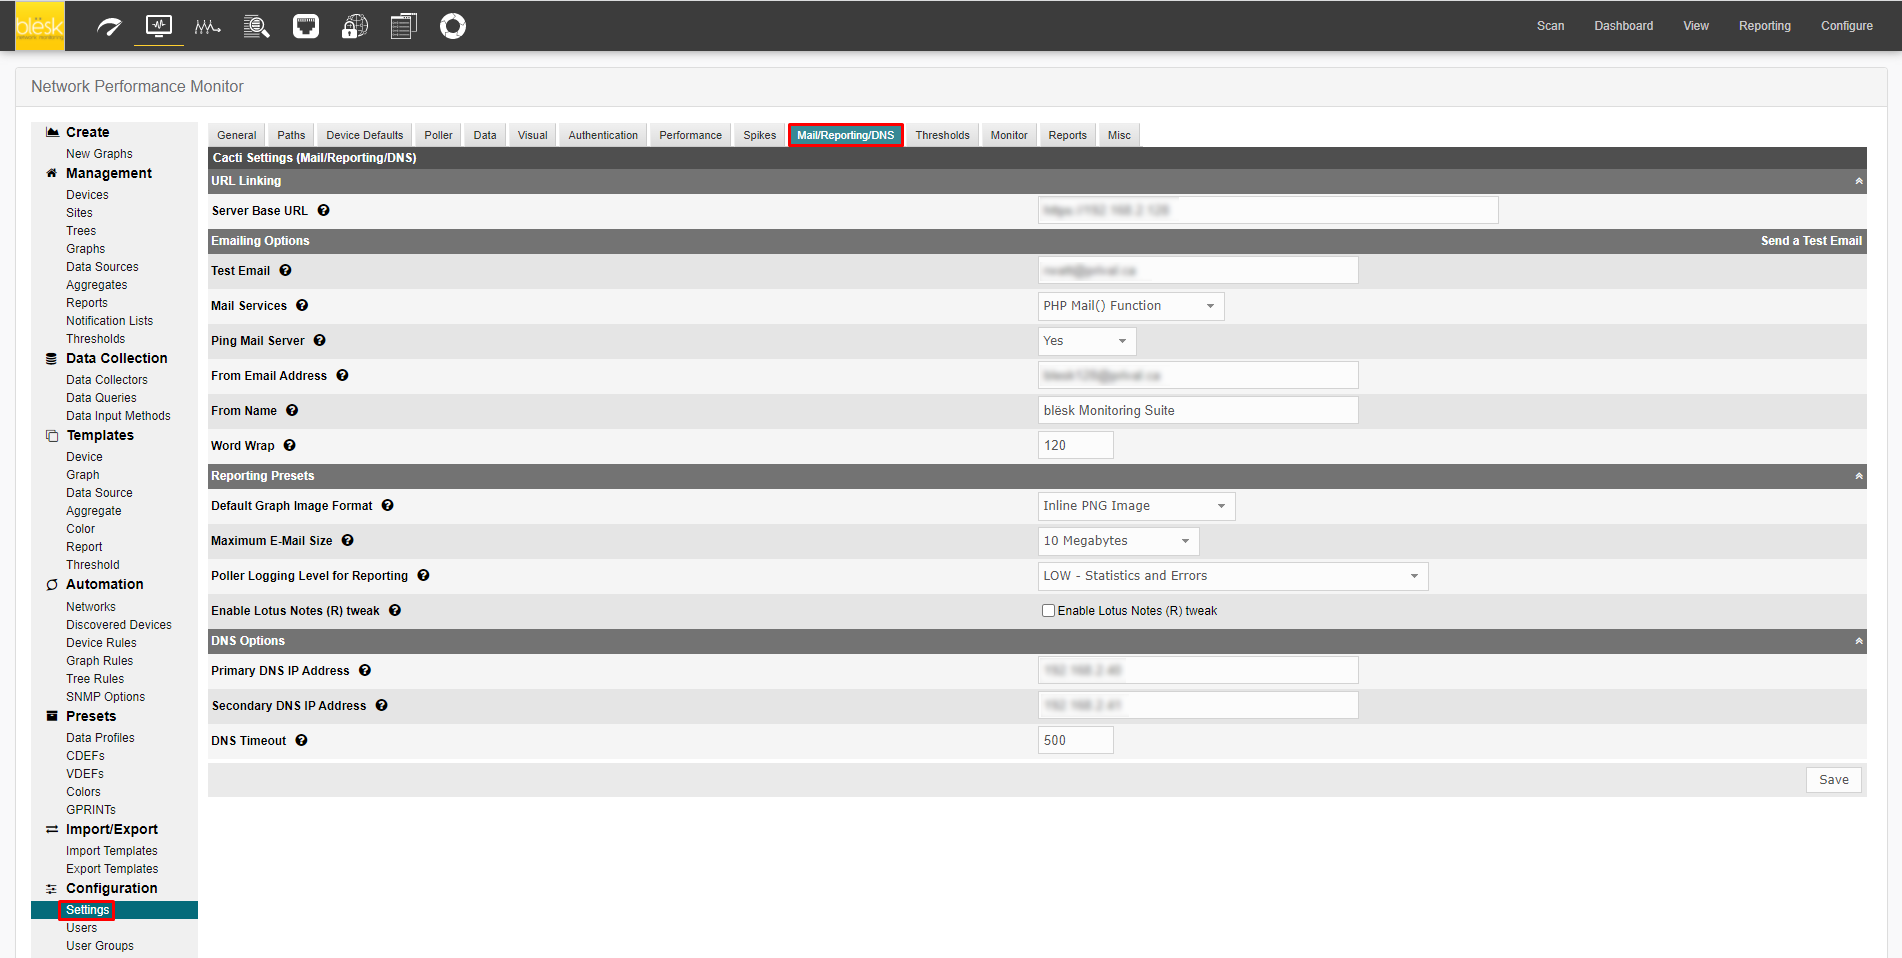
In this section, you will find information about the Email, Reporting and DNS settings. This information was collected during the installation of the software and you generally do not have to modify it.
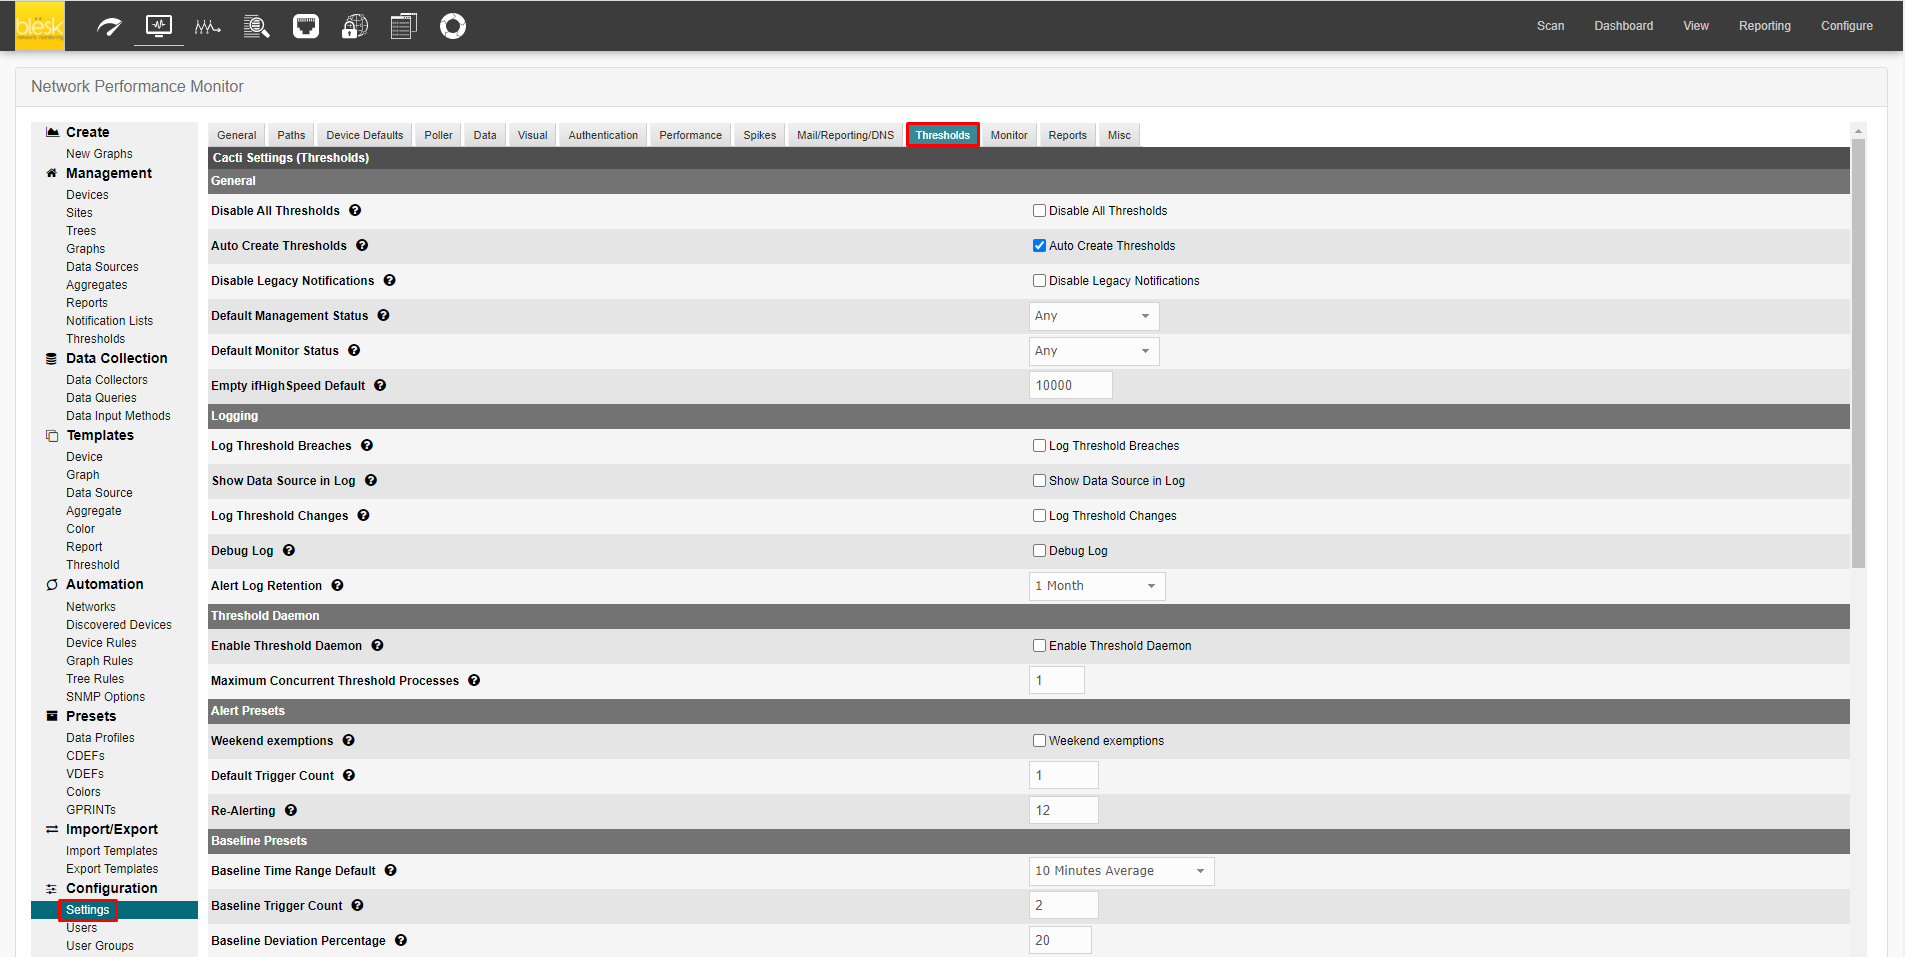
¶ Thresholds
This information was defined during installation, but if you wish to make changes you may do so here.
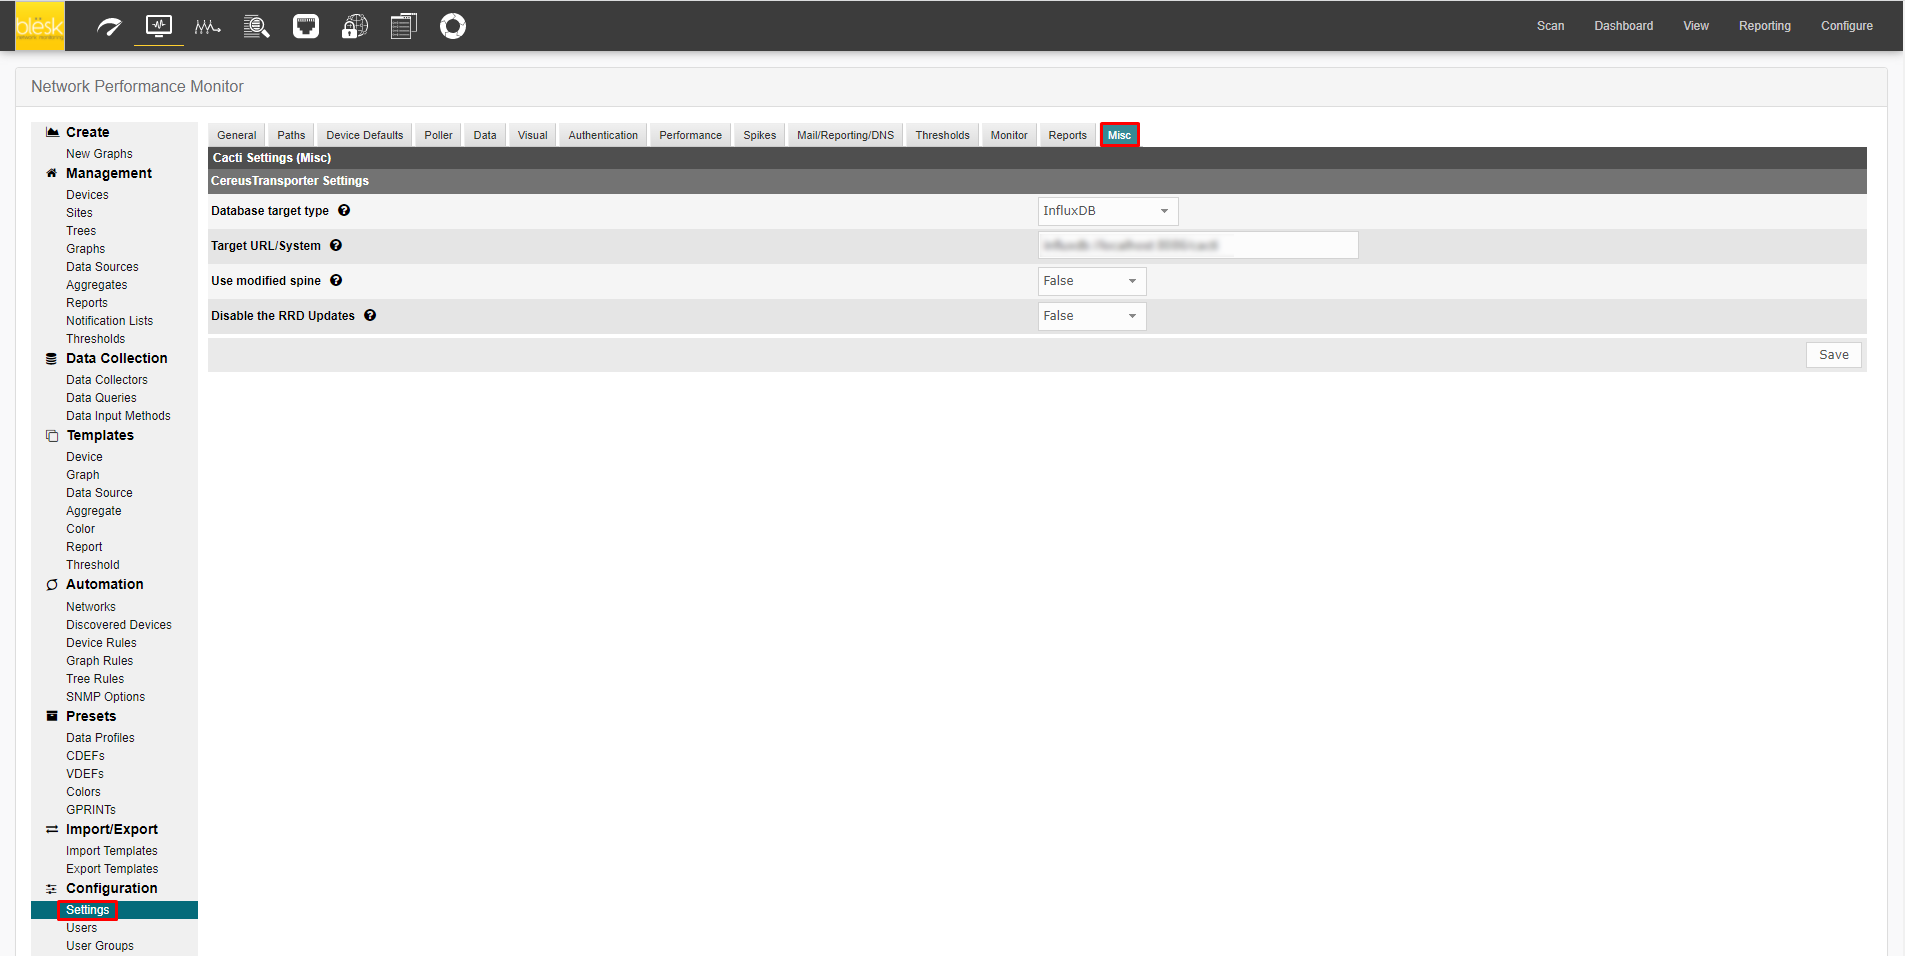
¶ Misc
This section allows you to control the auto detection feature of NPM and which information will appear under the “Discover” tab of the software. There are several important and customizable fields on this page.
The first is the “Subnet (s) to scan” Here you will enter the Network IPs of all your networks you want the auto detection to see (Use commas for multiple subnet. ex: 192.168.100.*,192.168.0.0/24).
The next field is the “Poller Frequency”, where you choose how often to attempt to find devices on your network.
In the “Start Time for Polling” you can specify the time at which the first polling will take place. The default is 12:00 am, but if you may change this value if necessary. For example, if you have installed NPM at 8: 35 am, you may not wish to wait until midnight for the first polling to take place. It is very important to understand that the software will only begin to fully work from the time you entered in the “Start Time for Polling” field.
The “ Rerun Data Queries” field will rerun all data queries on current hosts and will create graphs for all assigned graph templates and data queries. If this check is disabled, then you'll have to manually create graphs for the auto detected hosts you want to monitor with NPM.
In the lower part of the page, you can also change the format, size, and quality of the graphs sent with the reports.
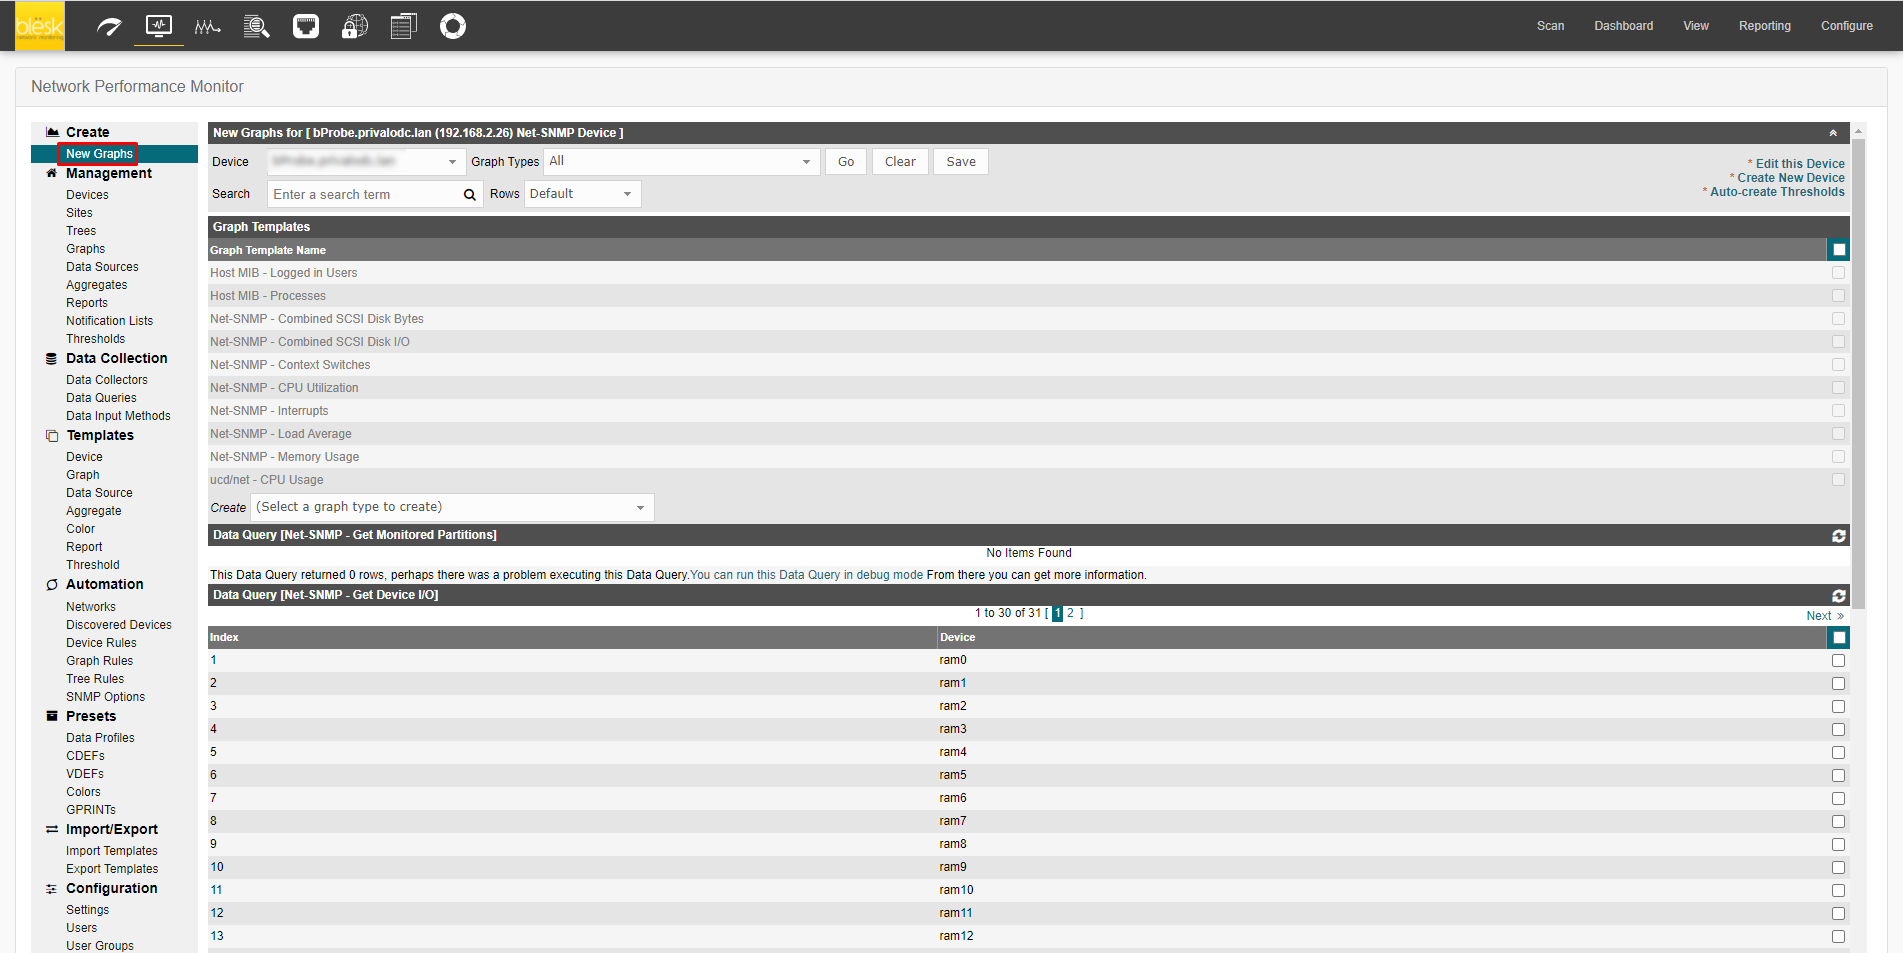
¶ New Graphs
Allows you to add new graphs for existing hosts.
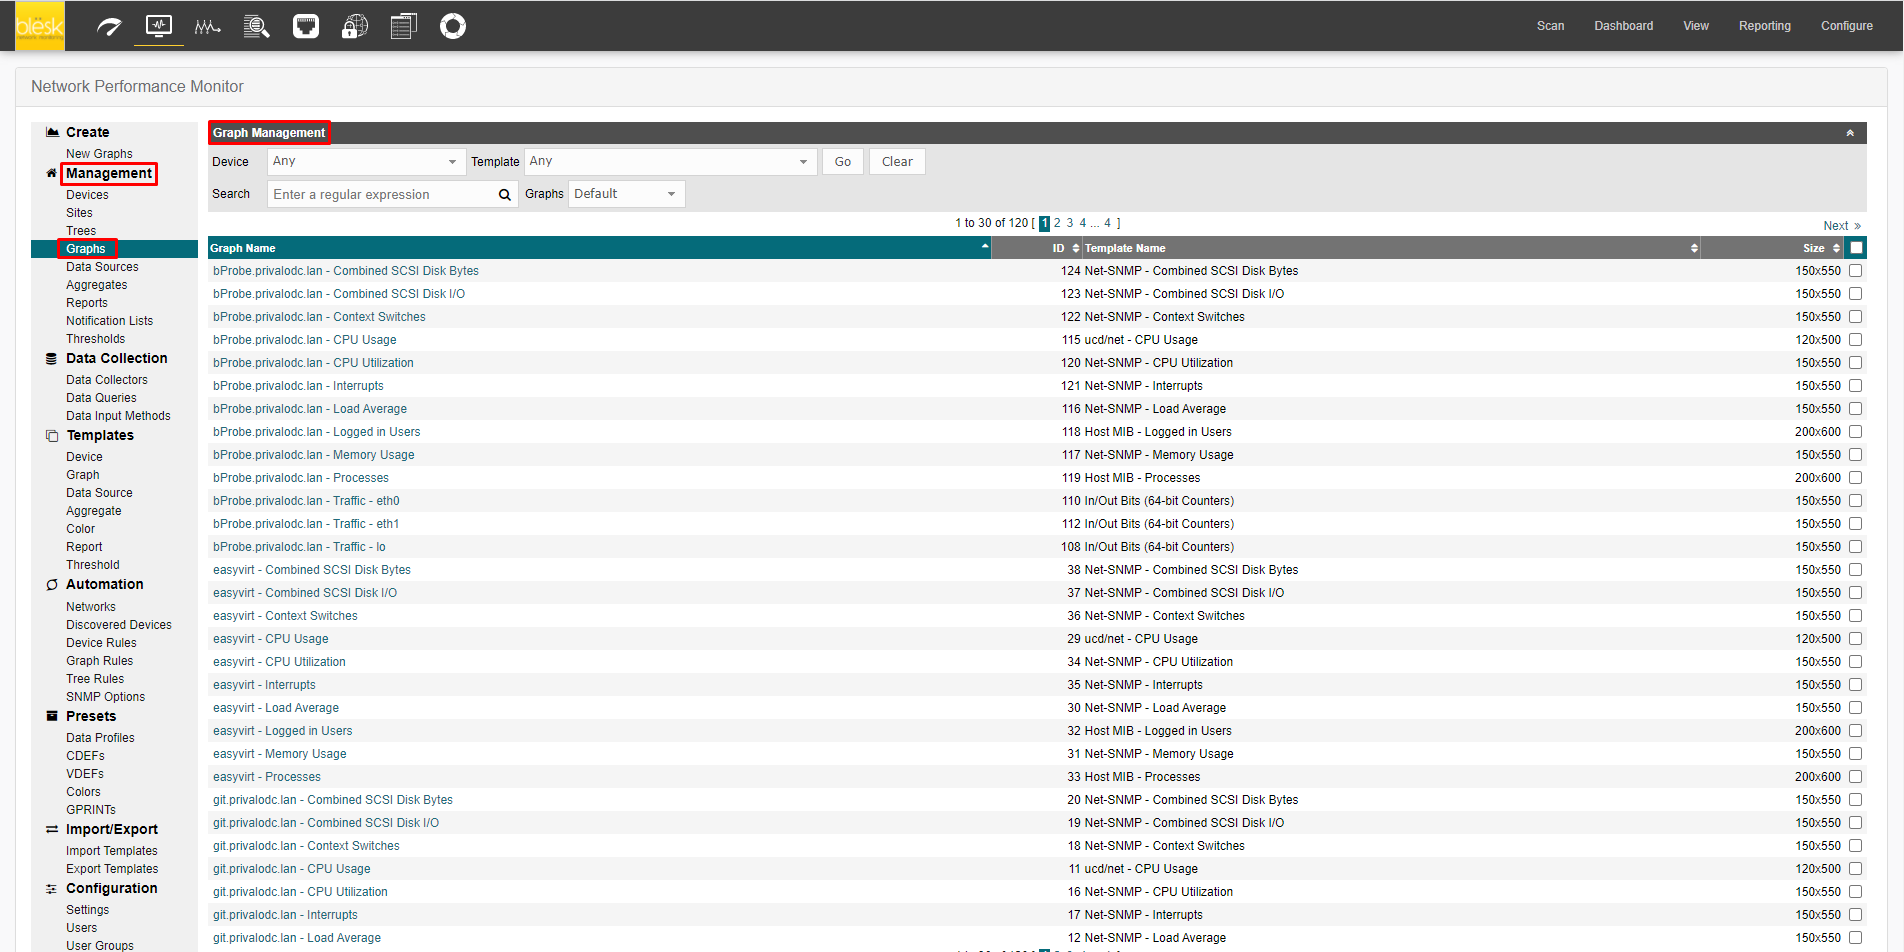
¶ Graph Management
This page allows you to manage the graphs by changing the titles, data, etc.
¶ CDEFs
CDEFs allow you to apply mathematical functions to graph data to alter output. The concept of a CDEF comes straight from RRDTool, and are written in reverse polish notation (RPN). For more information regarding the syntax of CDEFs, check out the CDEF tutorial.
¶ GPRINT Presets
A GPRINT is a graph item type that enables you to print the values of data sources on a graph. They are typically used to represent legend values on the graph. NPM enables you to keep a global list of these strings that can be applied to any graph item throughout NPM.
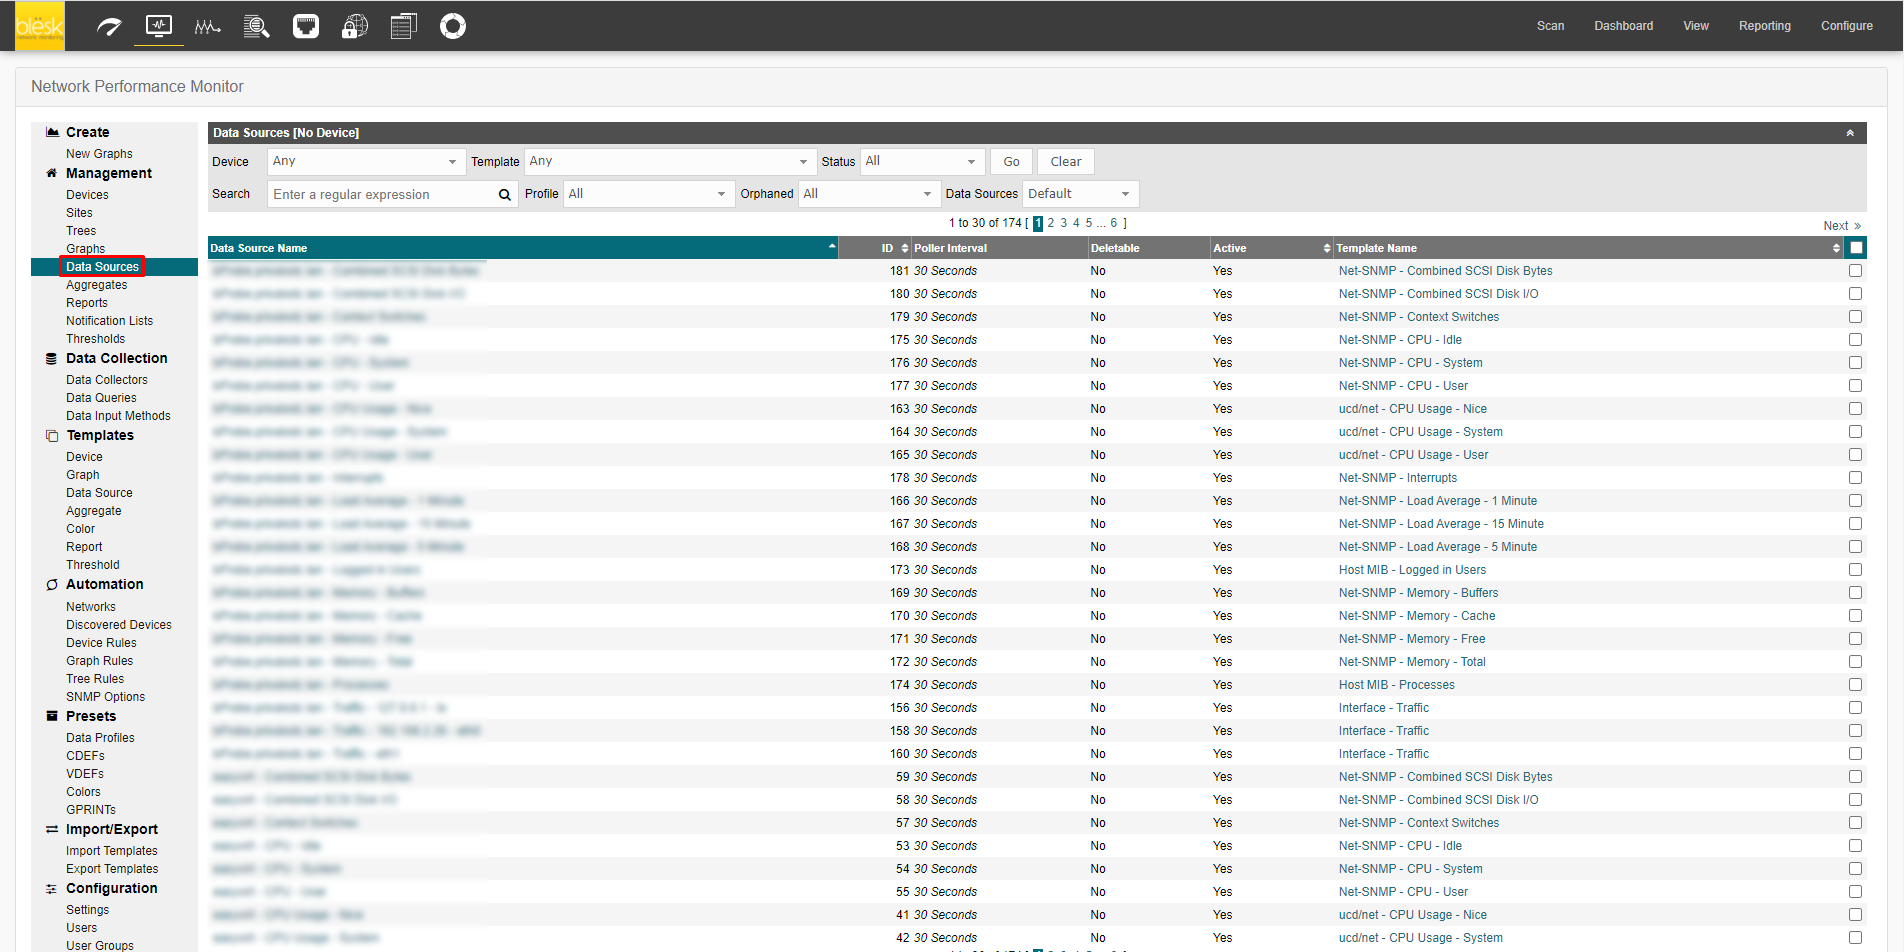
¶ Data Sources
Allows you to change the title of the graph and the name and path of the data source. Other information that you can change from this page includes the frequency of the capture information, such as changing from a 5 minute to a 30 second oscillation period (see RRAs bellow).
¶ Devices
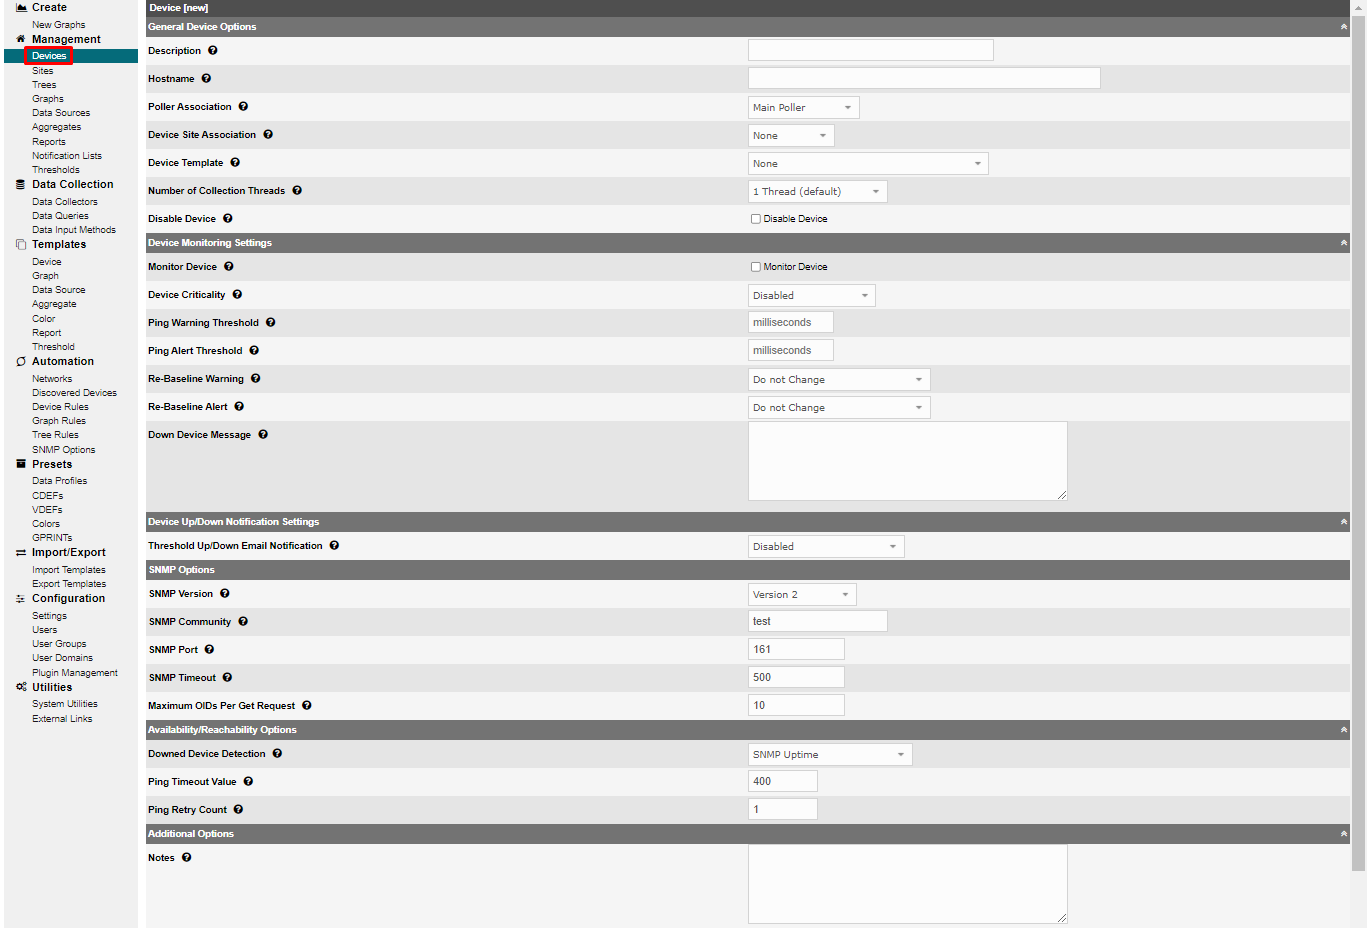
A general view of your monitored devices. This page is also used as the home page of the Administration section. Here you can manually create a new device by clicking the “Add” button.
The first step to create graphs for your network is adding a device for each network device that you want to create graphs for. A device specifies important details such as the network hostname, SNMP parameters, and host type. Assuming you've just logged in, you'll see a page like this. You may either click on the Devices menu item. Clicking Add will bring up a new device form.

The first two fields, Description and Hostname are the only two fields that require your input beyond the defaults. If your host type is defined under the host template dropdown, be sure to select it here. In this case “ucd/net SNMP Host” is used. It is important to remember that the host template you choose will not lock you into any particular configuration, it will just provide more intelligent defaults for that type of host.
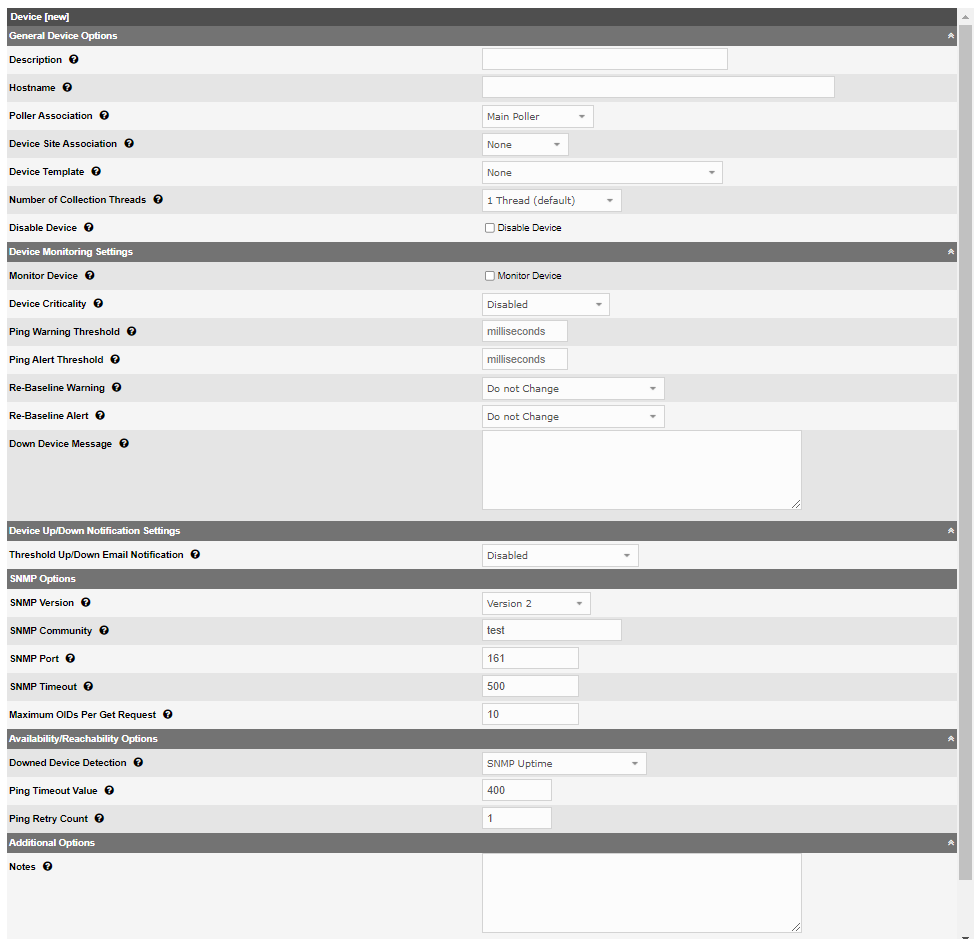
After saving your new device, you should be redirected back to the same edit form with some additional information. If you configured SNMP for this host by providing a valid community string, you should see various statistics listed at the top of the page. If you see “SNMP error ” instead, this indicates an SNMP problem between NPM and your device.
¶ Notification Lists
Define lists of users who are authorized to receive the reports and/or the thresholds alerts. From the selected list, you can associate hosts, thresholds and template. For threshold or template to be associated, they must be created before they can be used.

¶ Thresholds
This is the list of the thresholds created from the list or graphs. This allows you to generate and receive alerts with your own pre-built thresholds on the different graphs. Ex: If my threshold is 10 MB, I receive an alert at 9 MB.
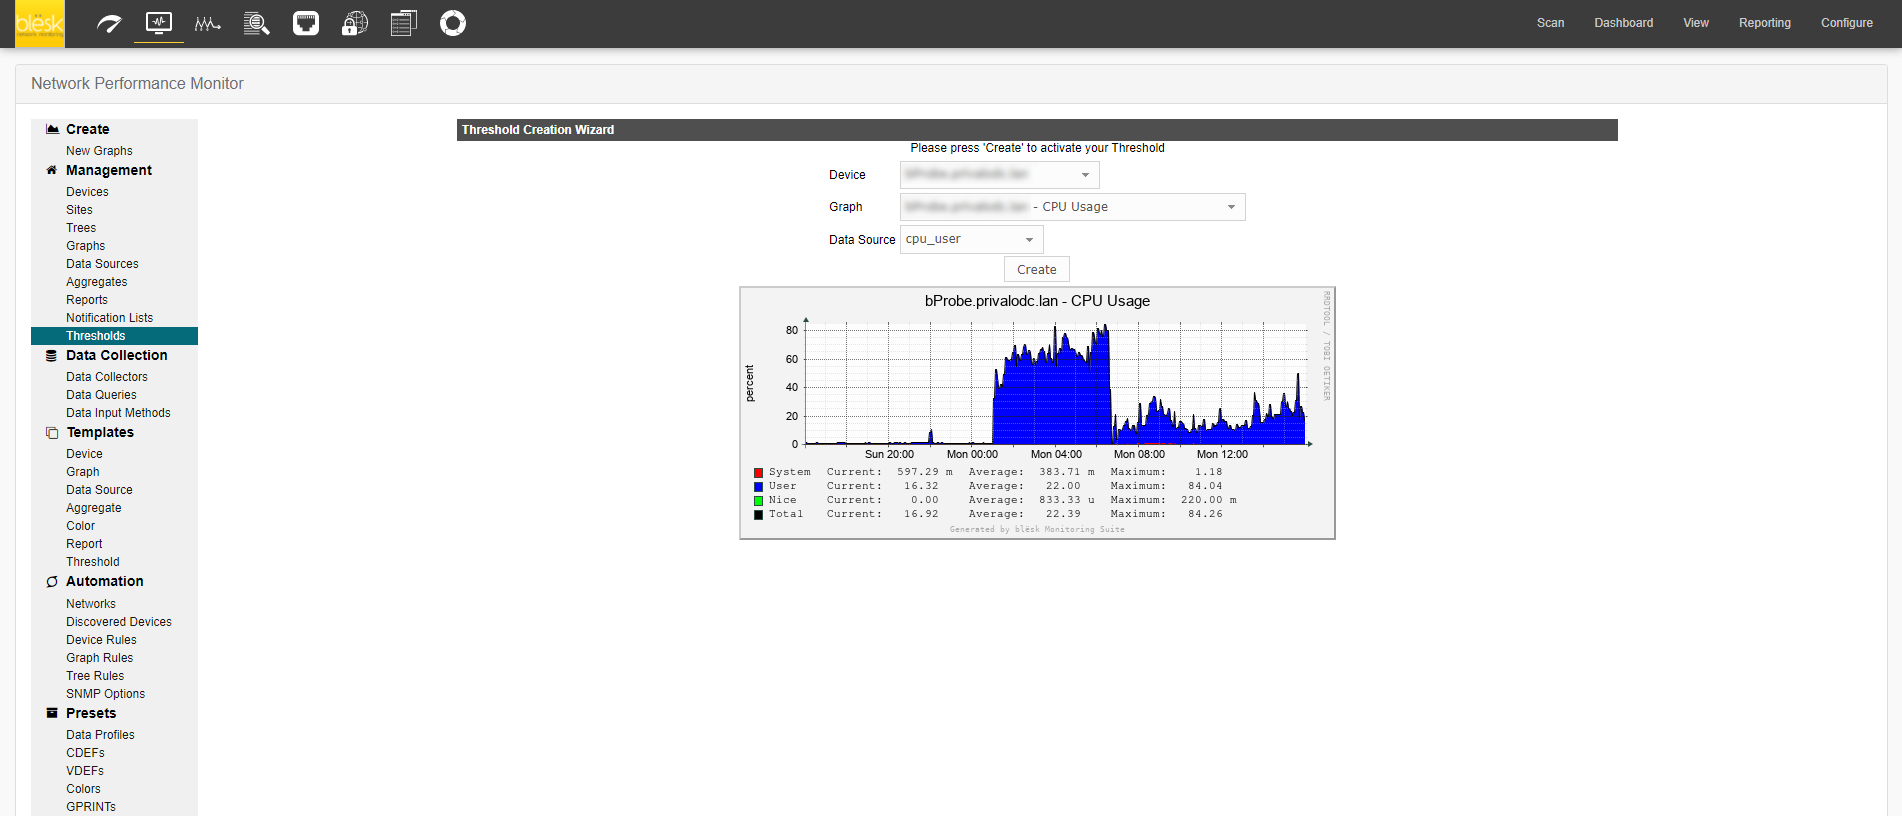
To add a new threshold, click the + button from the top right hand corner.

This will load the threshold creation page. On the top right, you can specify the data source.
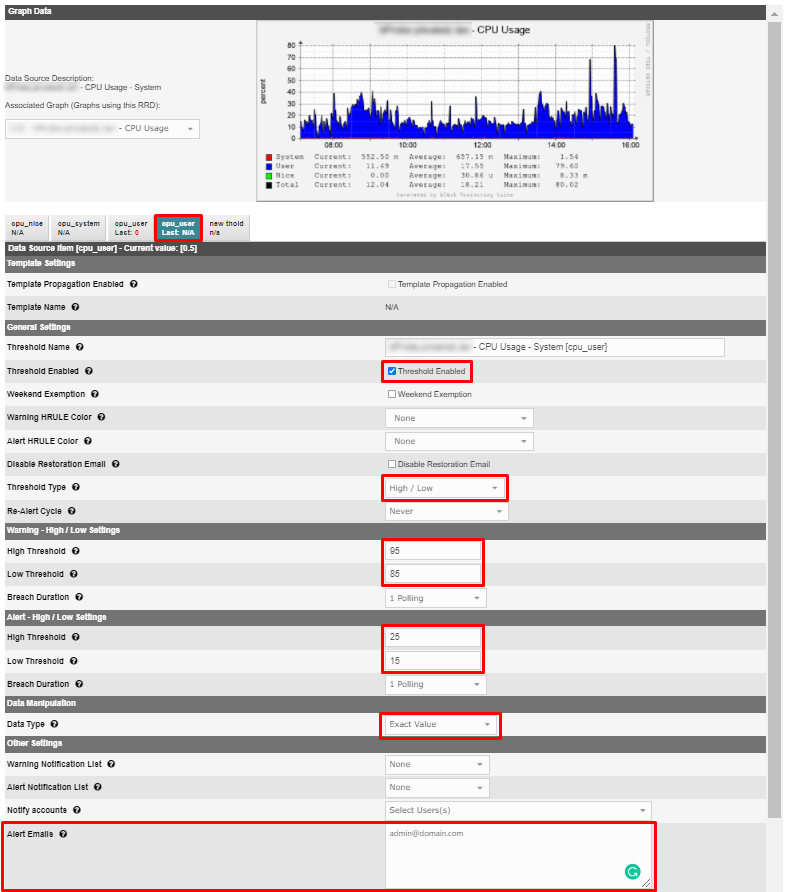
Next, you will verify the fields. Here are the most important ones:
Threshold Enabled – enable/disable the threshold.
Threshold Type – Here you will specify the type of threshold. You will need to specify the tolerance limits that you consider to be acceptable. You have the choice of different methods:
1. « High/Low Values » - determine the minimum and maximum limits.
2. « Baseline Deviation » - The following photo will help to explain this option.
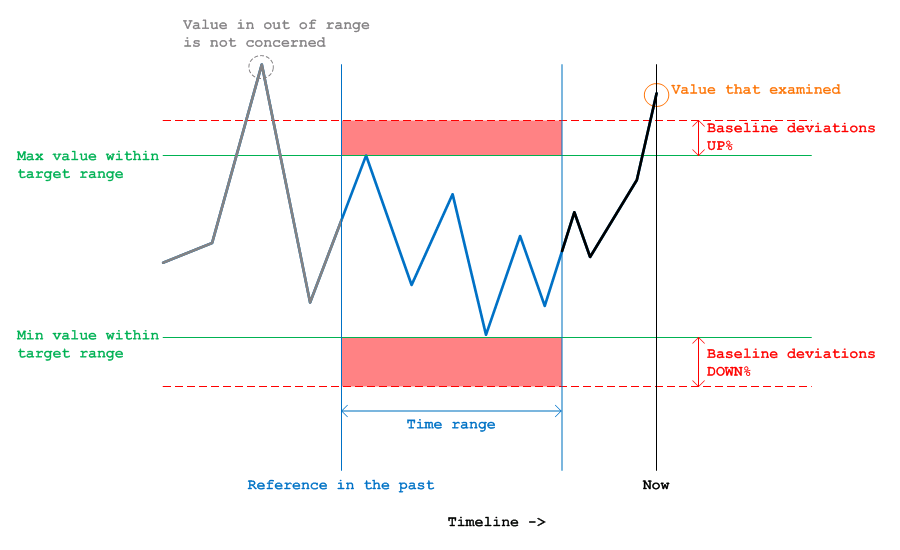
“Time Range” is the time during which the plugin will monitor variations of the value, and will register the lowest and highest points. These will be used as references in order to compare with “Baseline Deviation UP” and “Baseline Deviation DOWN”. There are three possible values for the “Time Range” - one day, 2 hours, or 30 minutes.
“Baseline Deviation UP” - In this field you will specify the maximum value as a percentage. Once this value is exceeded, the plugin will send an alert.
“Baseline Deviation DOWN” - The minimum value as a percentage. Once this value is exceeded, the plugin will send an alert.
Here is an example:
If your maximum value is 50 and the minimum is 10, and you have specified a margin of deviation of 100% of the reference value “UP”, and 50% for the reference value “DOWN”, an alert will be sent when the value exceeds 100 or goes below 5.
3. “Time based”
Here we define the maximum and minimum values, as we did for the option “High/Low Values”, but there is an extra value to consider called “Breach Duration Count”. In this field we will pre-define the number of times that the plugin will ignore the exceeding of limits. Here, contrary to the option “High/Low Values”, a single instance of exceeded limits is not enough to send an alert.
“Data Type” - Here you can choose from four options. The most frequently used are “Exact Value” and “Percentage”. The two others are more complex. If you are interested in using them, here is a site providing more information.
“Other Settings” - This is where you can specify the email addresses of the people who will receive alerts.
¶ Data Queries
Create a new collection methods and new templates. This page is mostly for advanced administration. The most common use of a data query is to retrieve a list of network interfaces via SNMP. If you want to graph the traffic of a network interface, first NPM must retrieve a list of interfaces on the host. Second, NPM can use that information to create the necessary graphs and data sources.
Data queries are only concerned with the first step of the process, that is obtaining a list of network interfaces and not creating the graphs/data sources for them. While listing network interfaces is a common use for data queries, they also have other uses such as listing partitions, processors, or even cards in a router.

¶ Data Input Methods
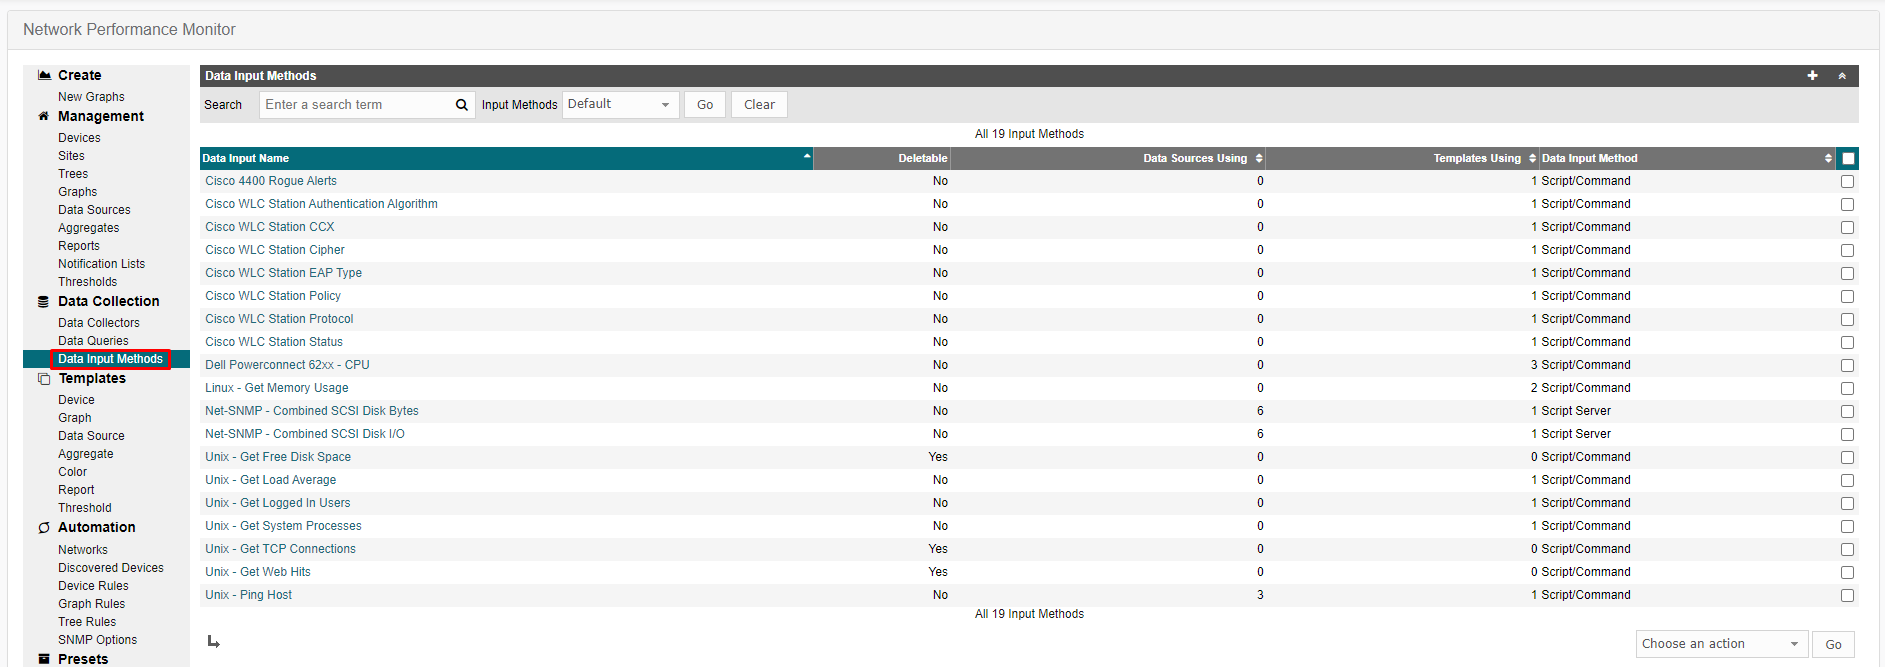
This page is for adding new scripts. It is an “Add-On” for Data Queries. Data input methods allow NPM to retrieve data to insert into data sources and ultimately put on a graph. There are different ways for NPM to retrieve data, the most popular being through an external script or from SNMP.
¶ Graph Templates
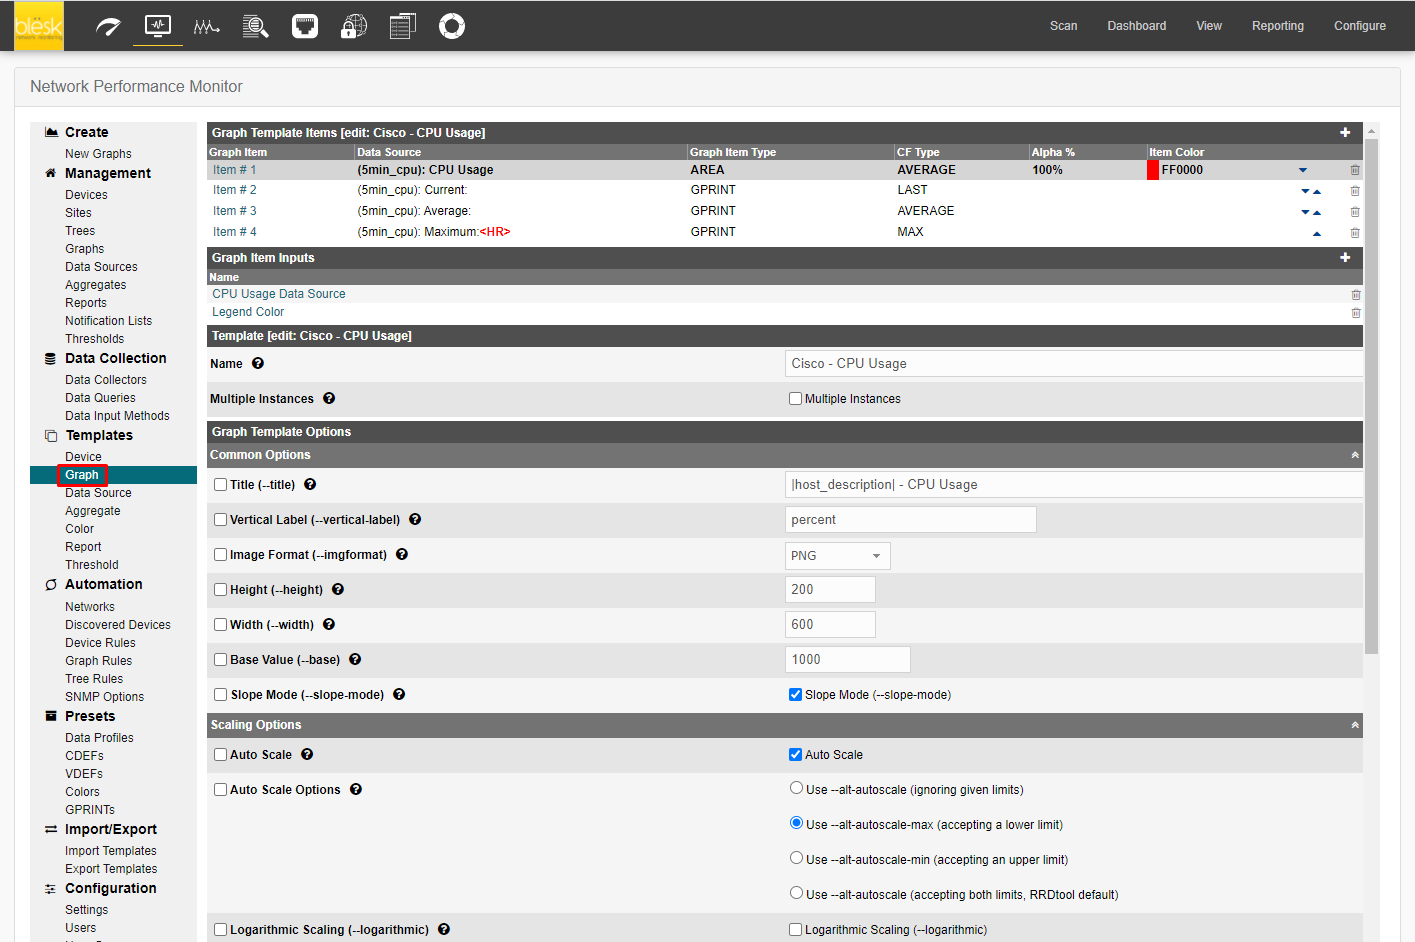
From this page, you can edit or create graph templates. A graph template provides a skeleton for an actual graph. If you have many graphs that share most of their characteristics, using a graph template would probably make sense. After a graph is attached to a particular graph template, all changes made to the graph template will propagate out to all of its graphs.
¶ Device Templates
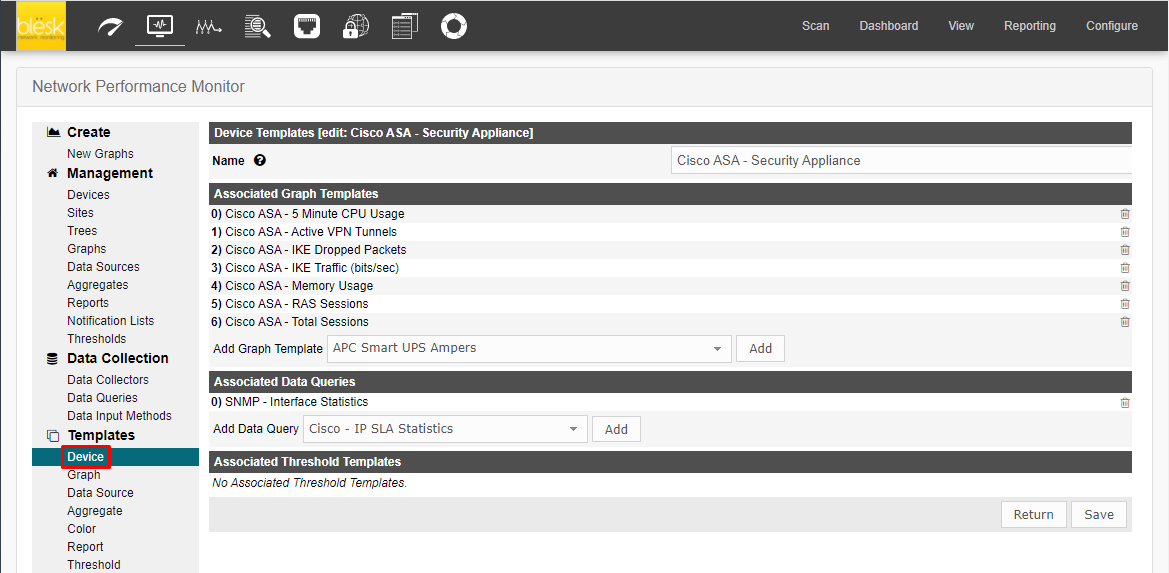
Allows you to edit or create host templates. The purpose of Device Templates is to group all Graph Templates and Data Queries for a given Device type. So you will make up a Device Template e.g. for a specific type of router, switch, host, and the like. By assigning the correct Device Template to each new device, you'll never forget to create all needed Graphs.
¶ Data Templates
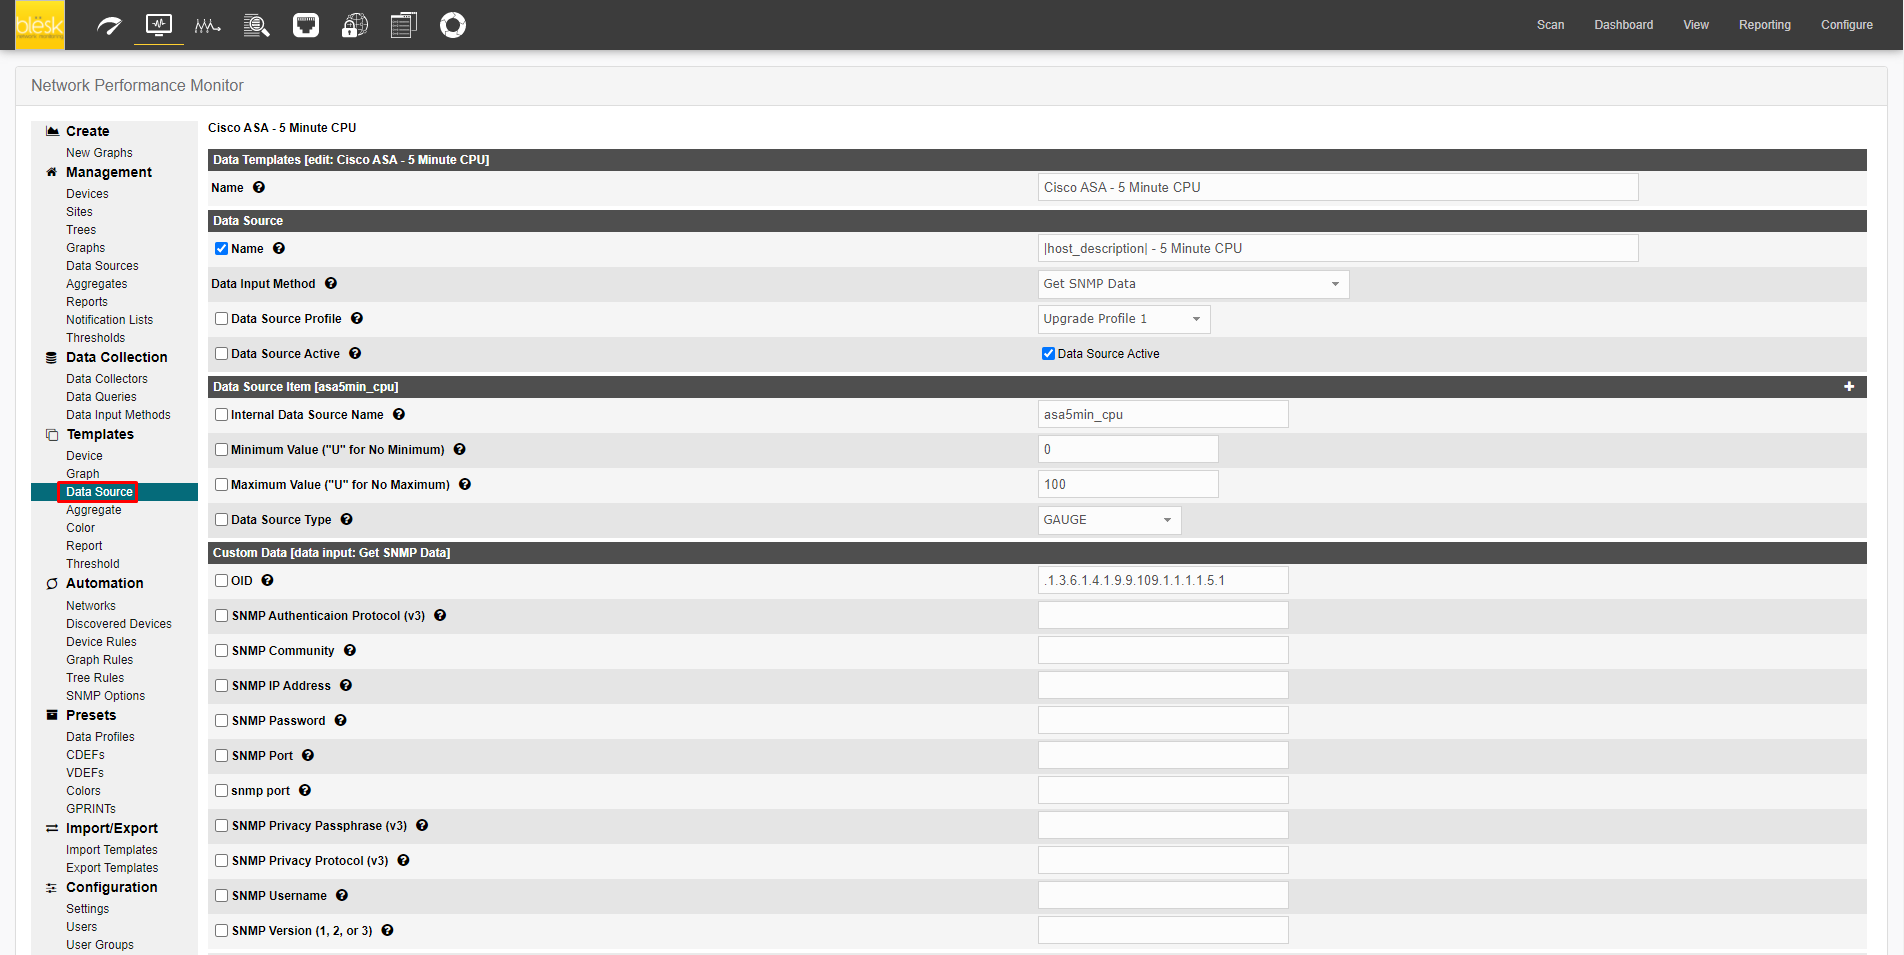
Allows you to edit or create data templates. All parameters needed to create a traffic rrd file are defined by a Data Template, in this case known as Interface - Traffic. These definitions are used by all Traffic-related rrd files. A data template provides a skeleton for an actual data source. If you have many data sources that share most of their characteristics, using or creating a data template would probably make sense.
¶ Threshold Templates
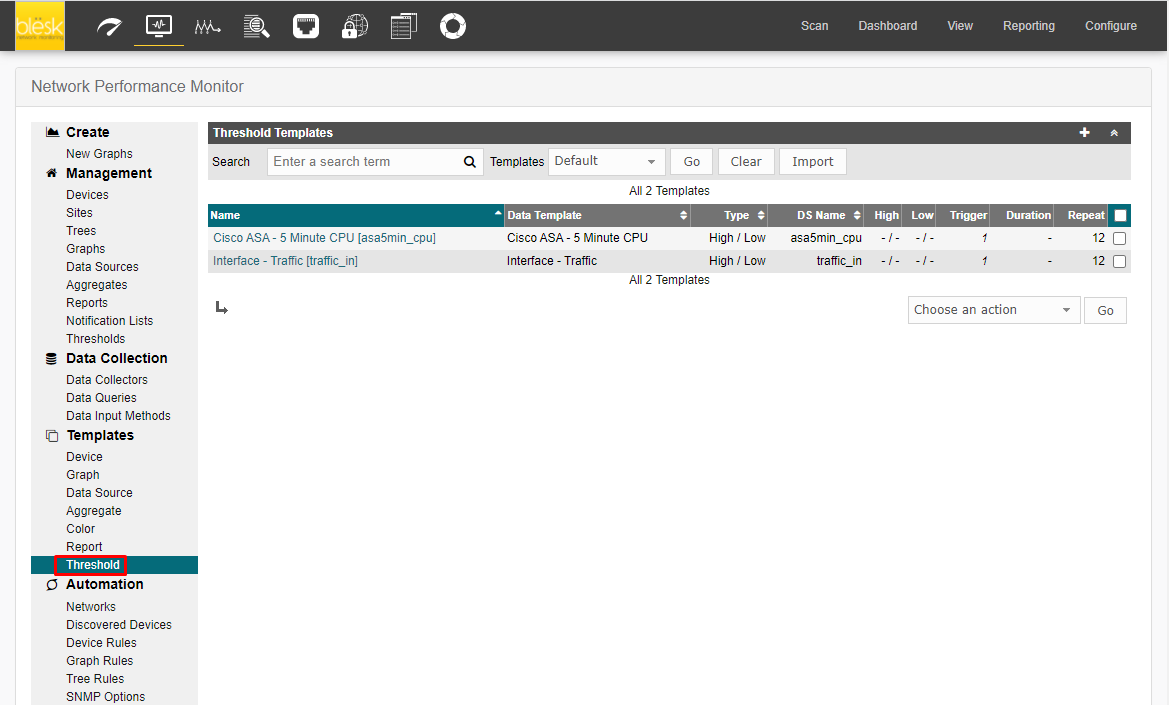
Here you can create a template that can later be associated with a threshold definition. This is useful when you have many thresholds that use the same parameter or values for certain parts of their definition and other specific values for other parts. Therefore, using a threshold template could help to minimize the effort required to create a new threshold definition in the threshold menu.
¶ Import Templates
Allows you to import templates. Assume, you're searching for a specific set of templates to monitor a special type of device and you can't find it. Apart from designing templates from scratch, there's a good chance to find a solution on the Internet, someone who has already created one.
The set of templates is usually provided as a single XML file holding all required definitions for a data template and a graph template. Depending on the goal of the original author, he/she may have provided a host template as well as part of this XML file.
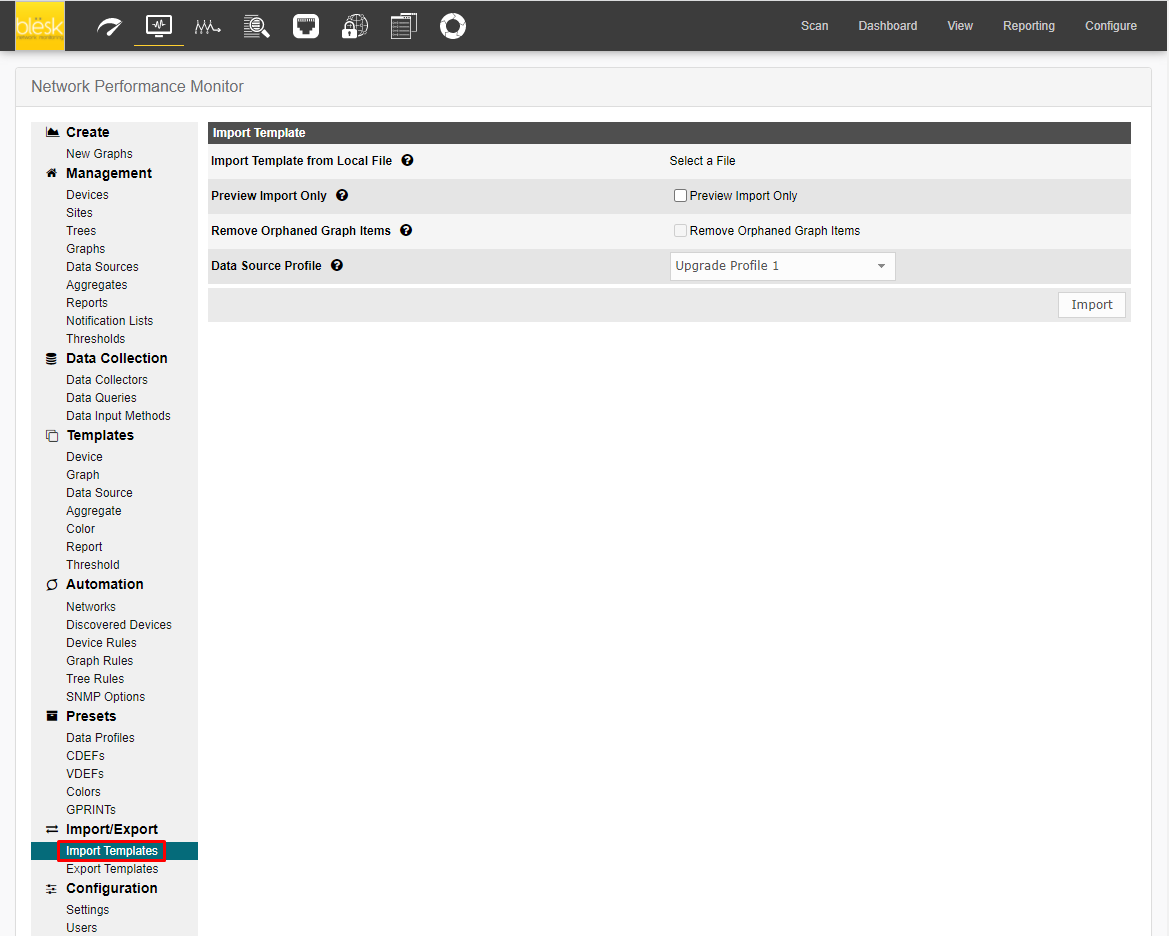
If the XML file was downloaded, you may import it from the file system via the “Browse” button. As an alternative, you may want to cut and paste the XML into the text box.
Please pay attention to the Import RRA Settings. By default, current RRA settings will be preserved, even if the imported XML file specifies different settings. This is recommended to avoid accidentally overwriting these global RRA definitions. If you are sure, you may override this default.
When importing templates, NPM will perform a version check. All XML templates hold the version of the NPM system that generated this XMLset. NPM will import only, if your current NPM version equals or is higher than the exporting one.
¶ Export Templates
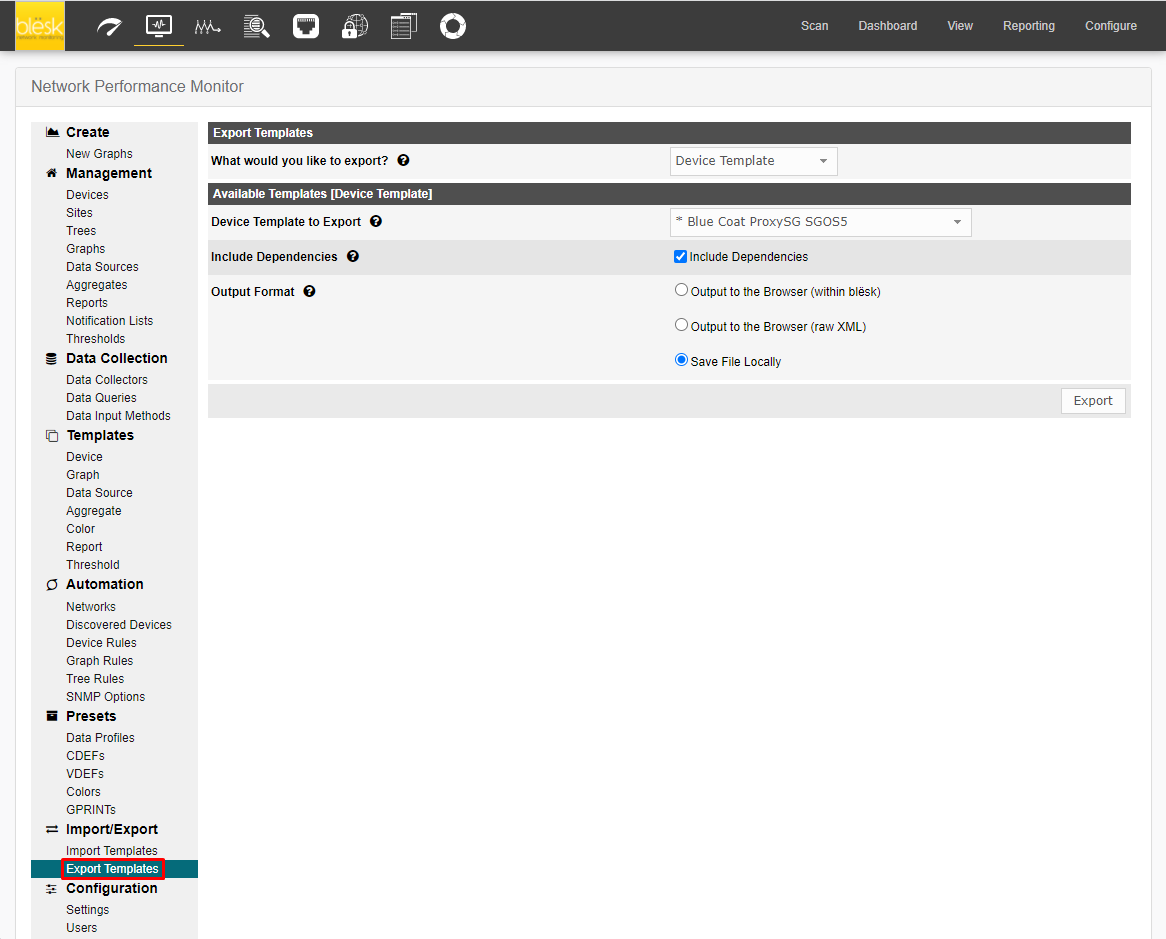
Allows you to export templates. You may select to export a graph template, a data template, a host template or a data query. When selecting Include Dependencies, e.g. a host template will include all referred templates (graph template, data template and, if defined, data query). Output may be written to the browser or to a file for uploading.
¶ Plugin Management
This page lists all the plugins implemented in NPM.
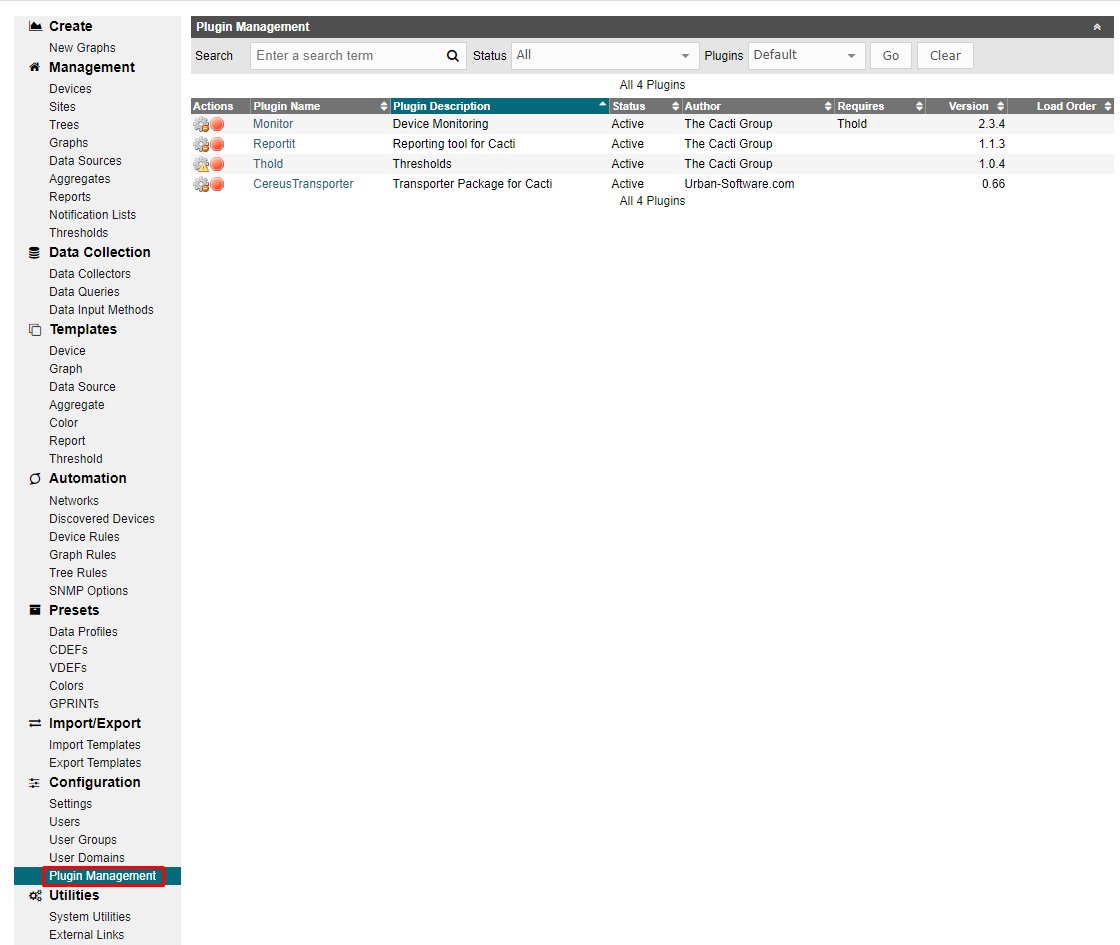
If you need to integrate new modules, we recommend that you send them to us so that we can do it for you. The inclusion of any module not tested by our experts may cause adverse effects on the NPM “blësk” software.
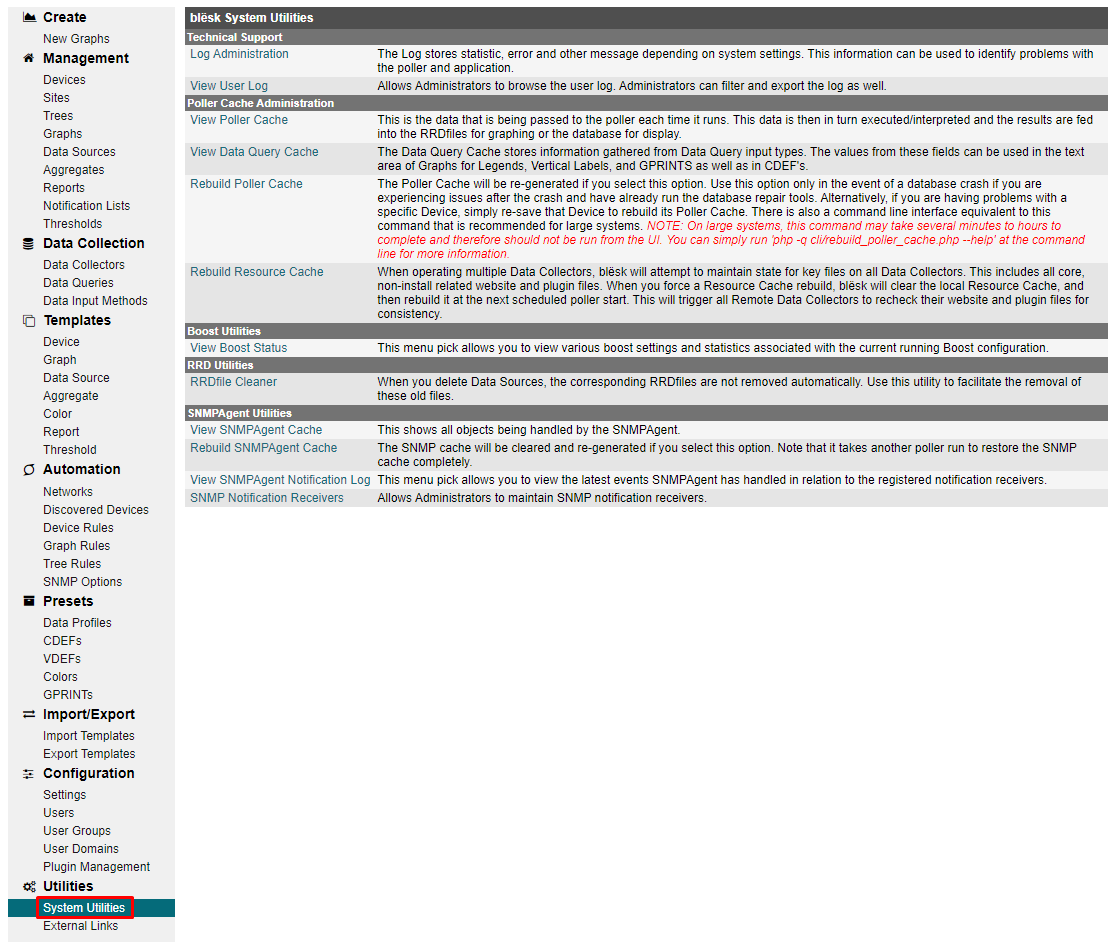
¶ System Utilities
In the “System Utilities” section you have access to all your logs and poller cache information. The log will let you see SNMP calls and user login activities in NPM. The poller cache will let you see requests made by data and SNMP. The “Clear Discovery Results” link gives you the possibility to reset all auto detected devices available under the 'Discover“ tab and start a new pool.
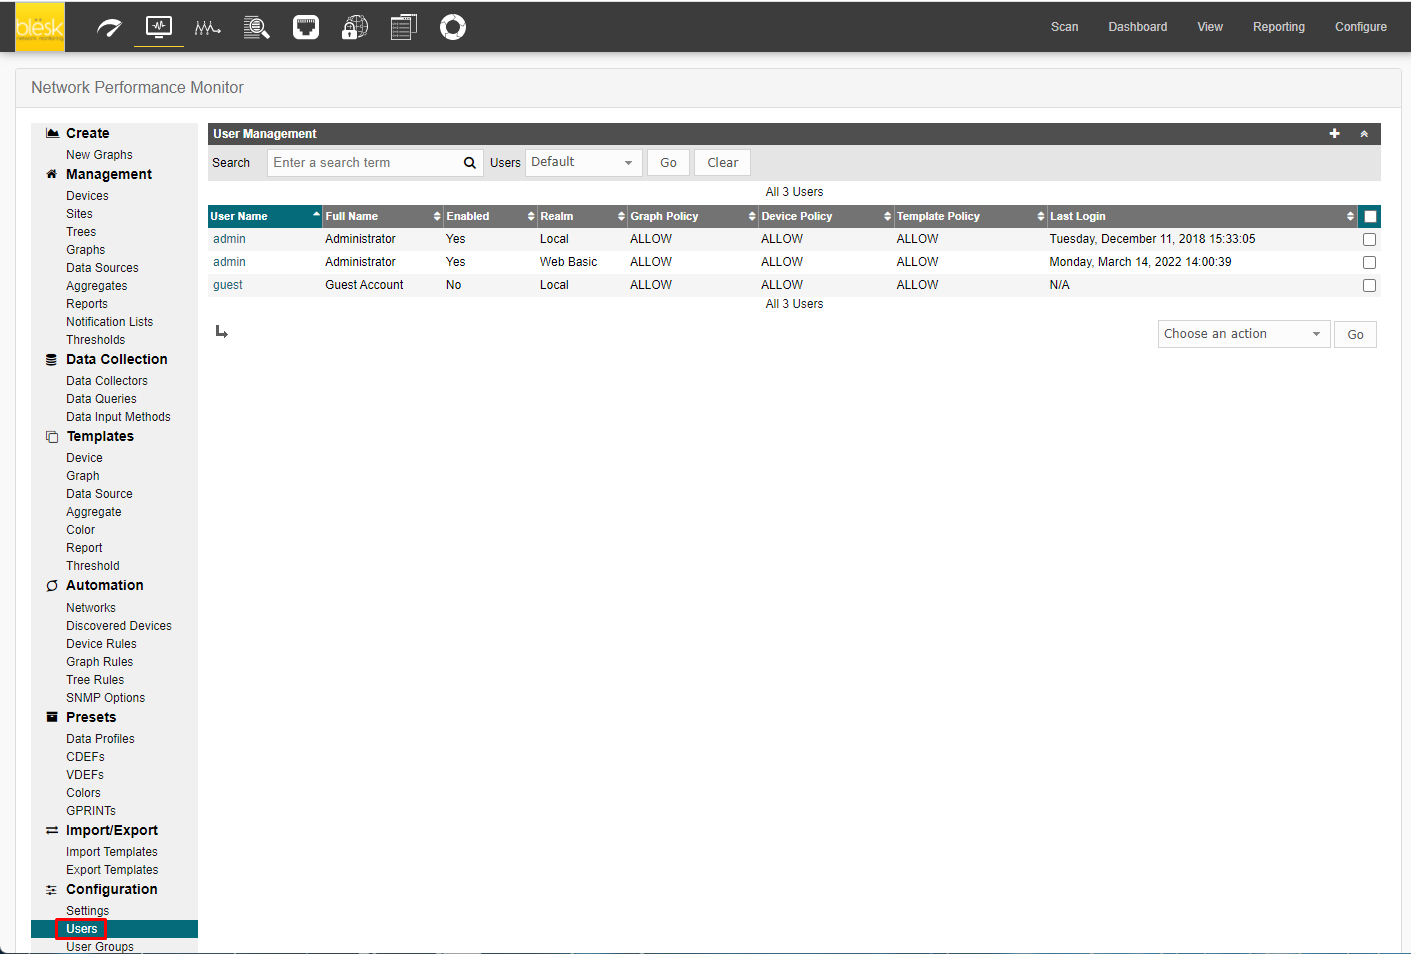
¶ User Management
From this page you can manage the users of NPM. You can create users that are tailored specifically to their requirements. Each user has certain settings such as login actions, as well as graph viewing settings. There are also two levels of permissions control; realm permissions and graph permissions, which enable you to control what the user can see and change.
¶ Quick Start
This quick start guide will help you to quickly start graphing data from your network devices in Network Performance Monitor.
We recommend using the auto-discovery features of NPM to make adding hosts easier. Click the Discover tab to see the list of detected devices. On the right side of this page are two columns; SNMP and Status. If both of these are shown as being “Up ” for a device, then you can click Add to create a graph.
The SNMP credentials used are those that you specified during the installation of blësk. If you wish to modify the credentials, you may do so by clicking the Administration tab and selecting Settings from the left side menu. The SNMP credentials are located under the General tab.
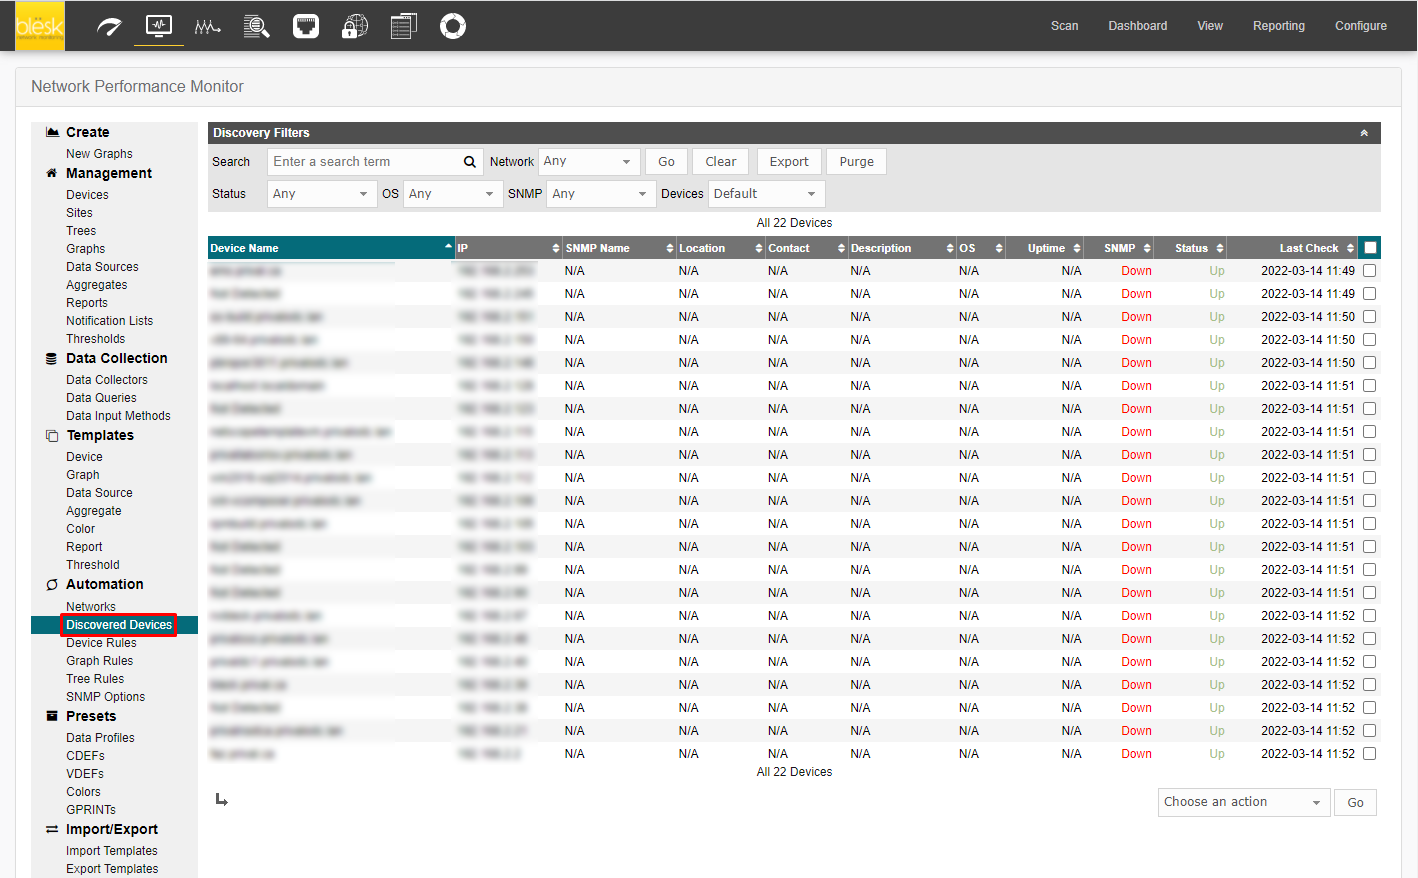
¶ Adding a graph
Clicking “Add” for a device will load the graph creation page shown below. Here you will need to provide a name and select a graph template for your device. Verify that the other information is correct, and click “Create”.
If there is a problem with the addition of the device, an error will appear. If not, click Save. The new graph for this device will soon be displayed in the main views along with the others.
If error appear, this mean that the device you want to monitor doesn't have SNMP activated or configured to allow blësk to talk to it.