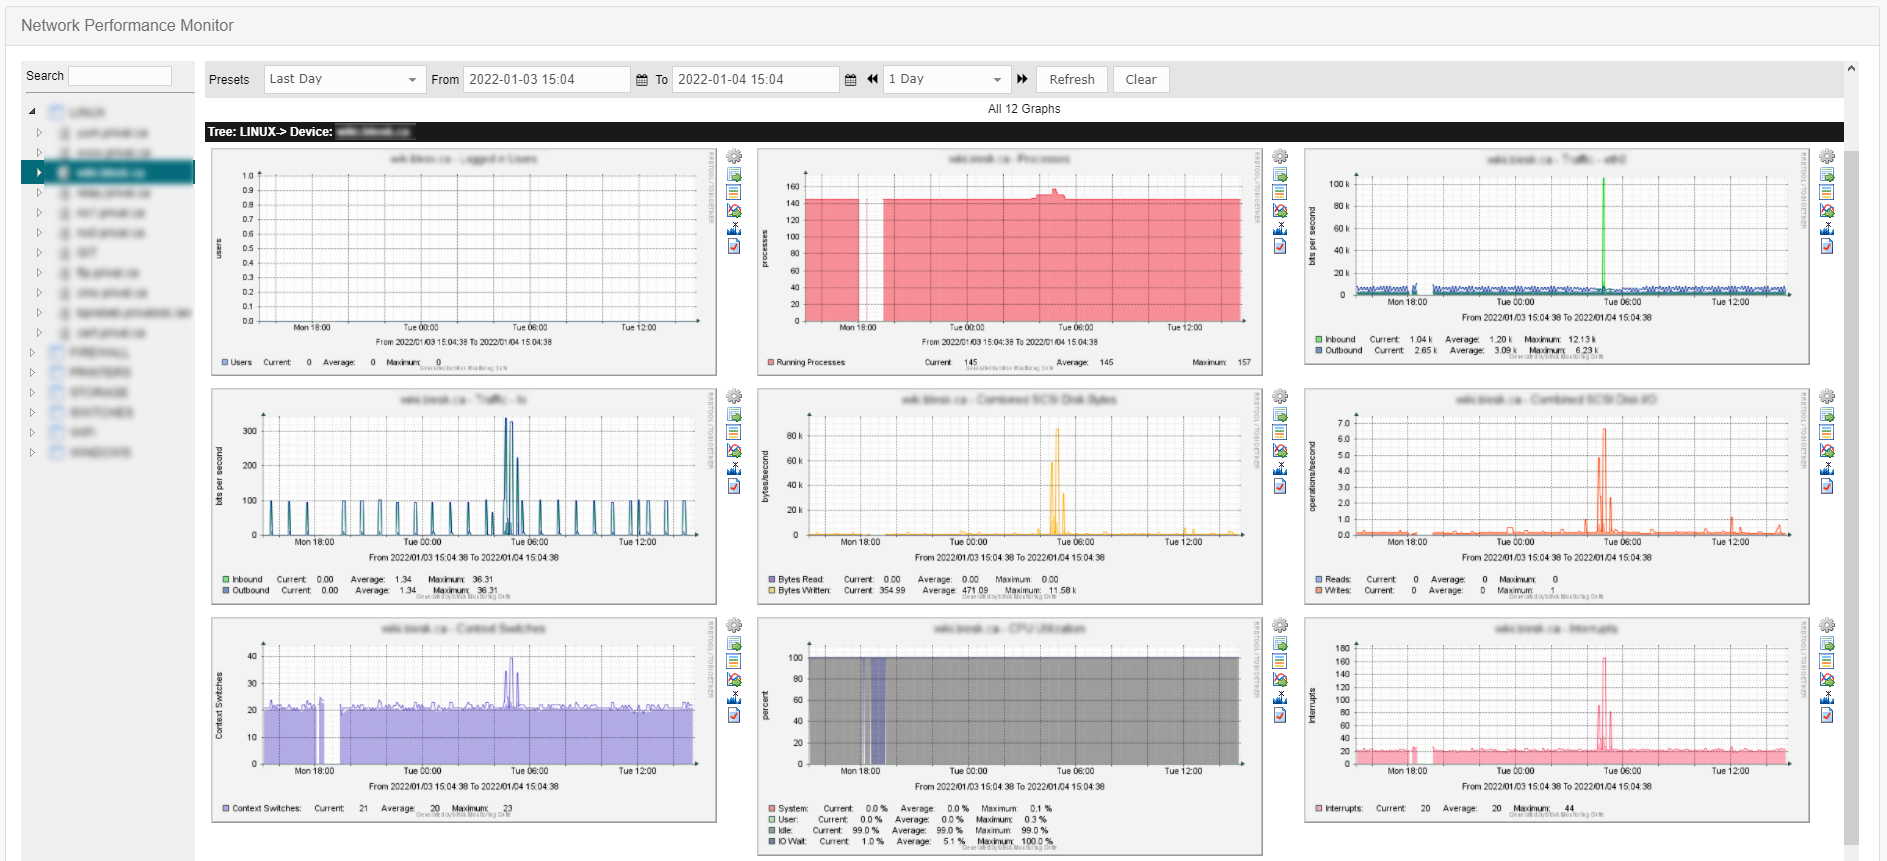
¶ Dashboard
By default, on the dashboard the service list of Network Performance Monitor (NPM) module appears as tree view. This view allows to view the available graphs by tree or as dashboard. You can filter information to find data by frequency, for example. There are icons on the right of each graph to make it easier. You can click on the graph directly to zoom in and to define alert thresholds.
