¶ Introduction
blësk Network Performance Monitor (NPM) improves the performance and health of your network. It is used to trace serial data such as CPU load or the use of bandwidth. It collects, analyzes, and measures performance data for SNMP compliant devices in near real time.
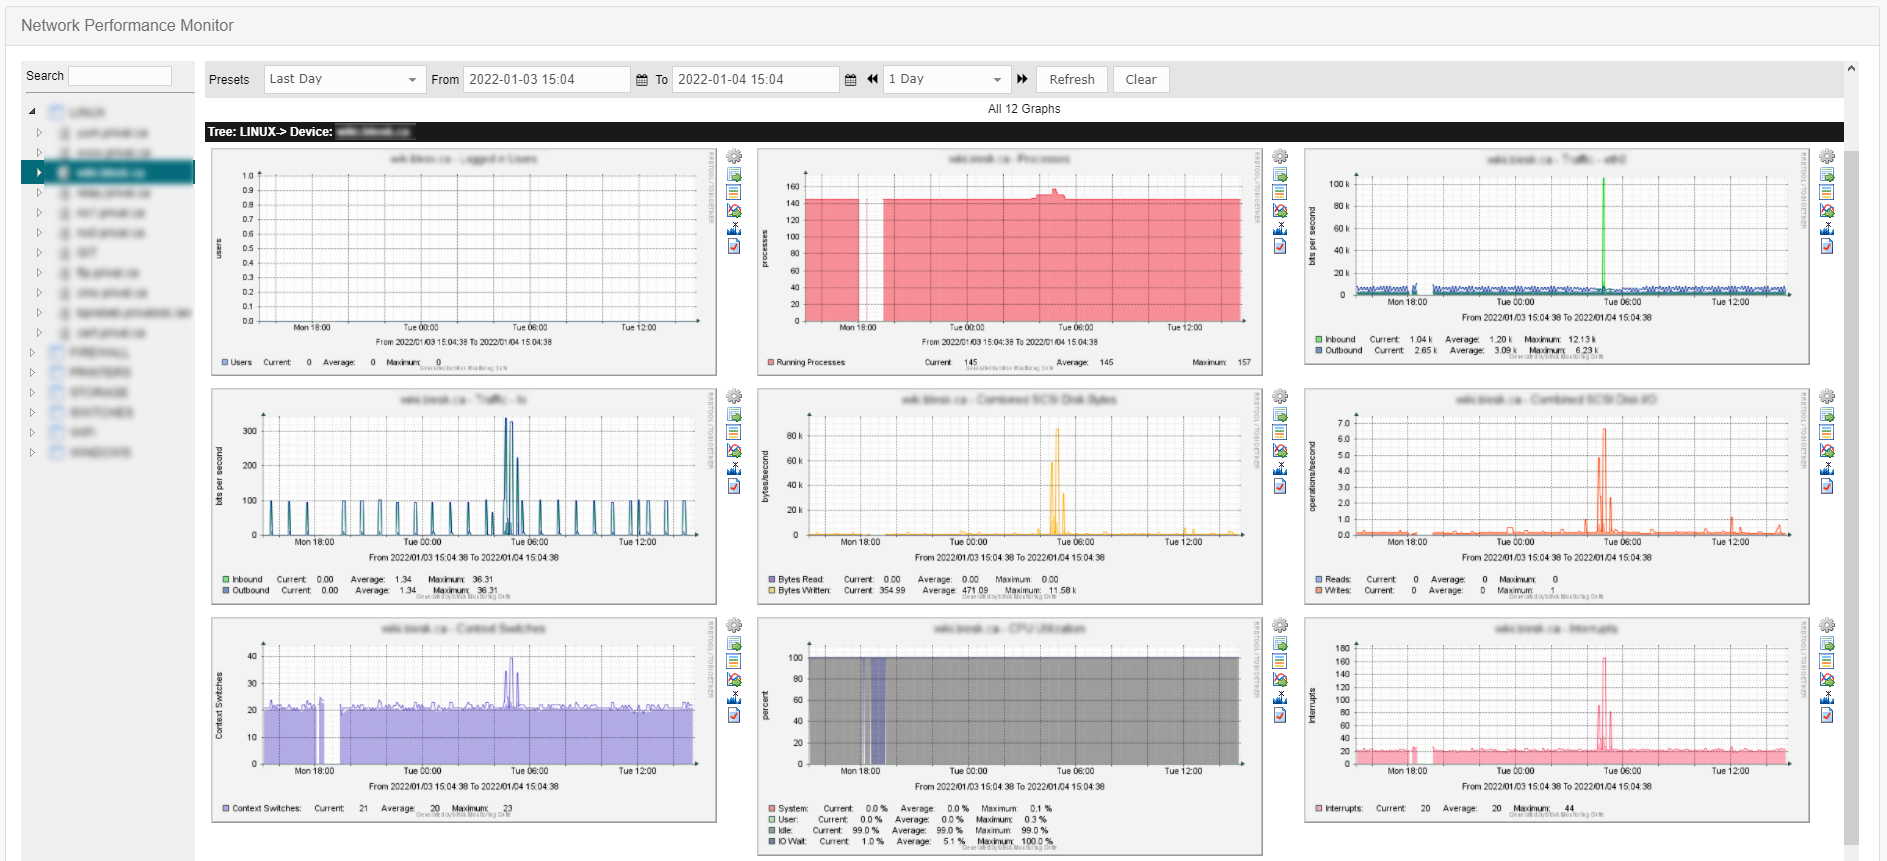
blësk NPM creates a service-oriented view of your IT infrastructure and identifies the main network problems. It automatically detects, maps and monitors all devices on a network and presents graphs and interactive linear tables. Thanks to innovative technologies integrated with NPM, your IT team can query services at predetermined intervals and can graph the resulting data.
NPM detects, diagnoses and helps resolve performance problems before breakdowns occur. NPM collects and analyzes data from routers, switches, servers and other SNMP compatible devices in almost real time, presenting the data in graphs for detailed monitoring.
See the Quick Start guide for examples on how NPM collects and analyzes data from routers, switches, servers and SNMP compatible devices.
