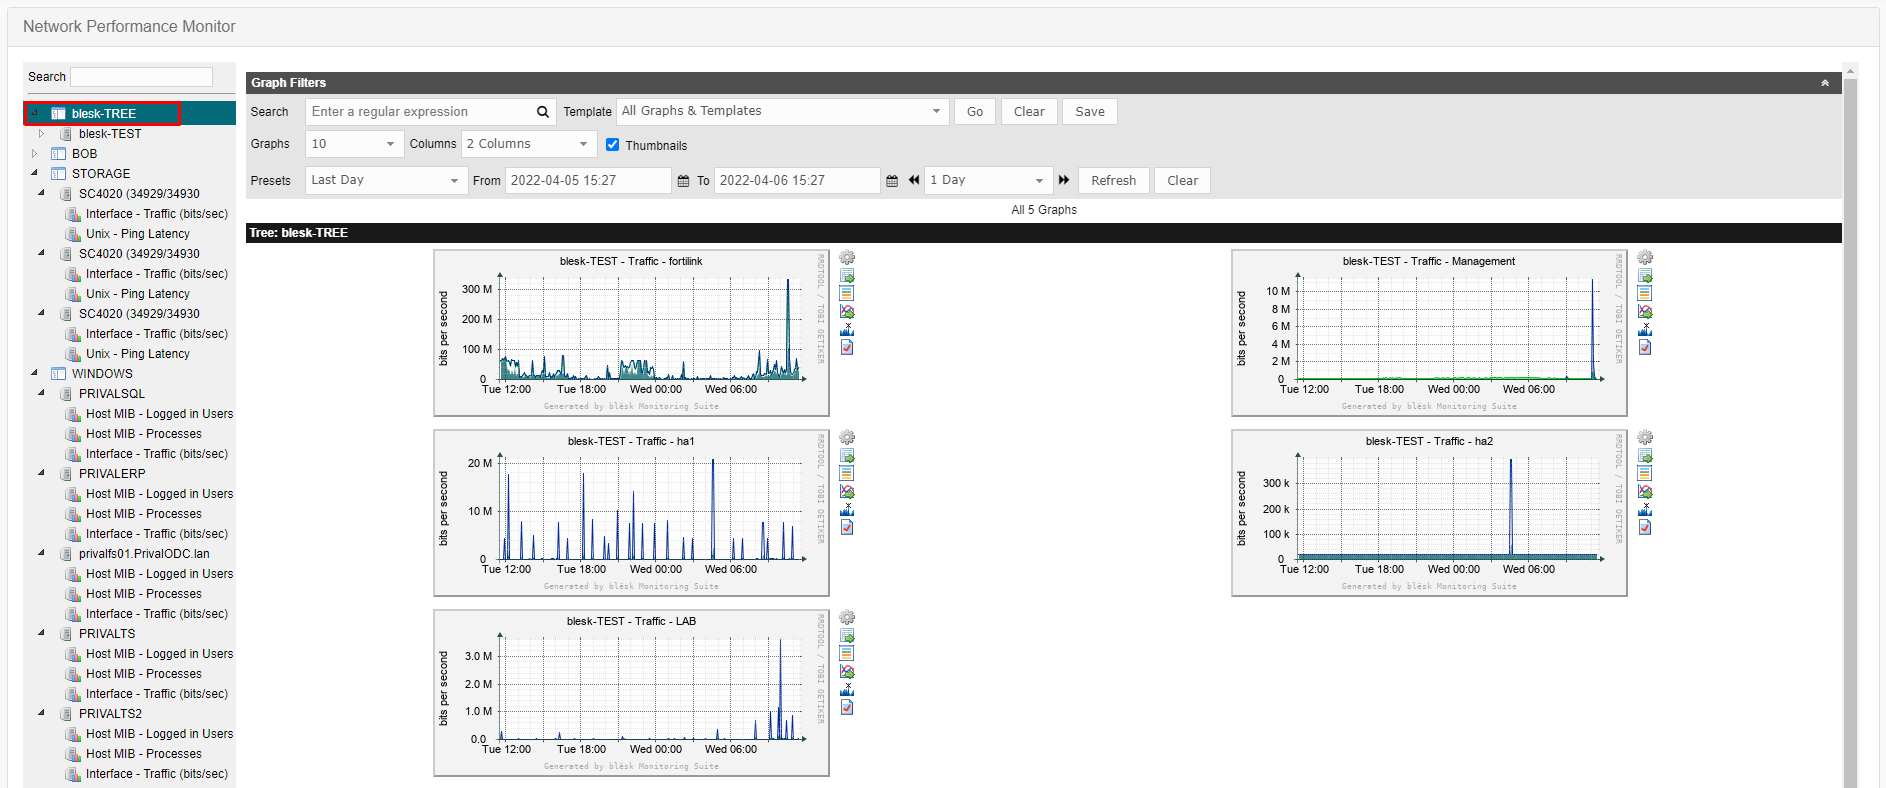
This Quick Start guide will help you to start using the blësk Network Performance Monitor (NPM) after installing the blësk Network Monitoring system.
¶ Add a device
Click on Configure from the top menu to navigate to the Configure page and click on the Devices from the left-hand menu located under the Management option. The existing devices are listed on this page.

To add a new device, click on the Plus “+” icon located at the top right-hand corner, which will open the page to add a new device.

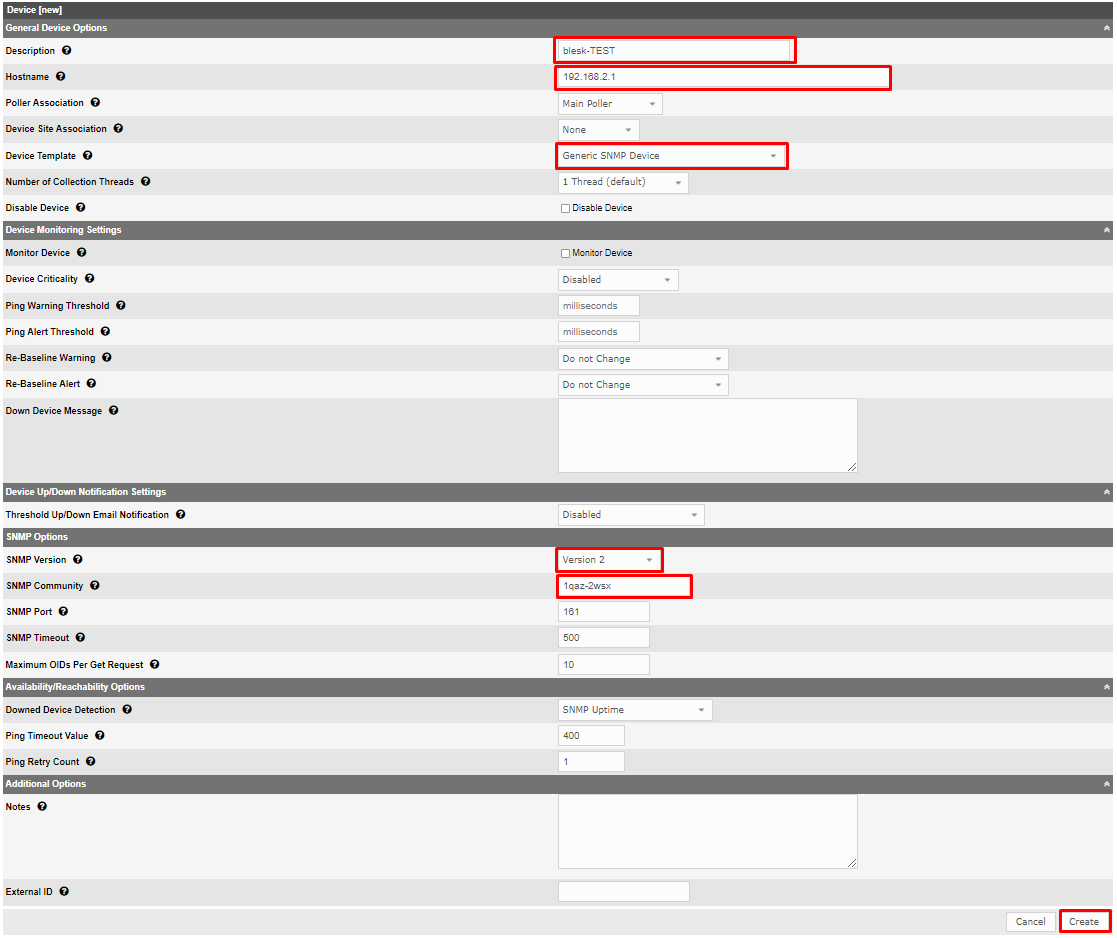
On this page do the following:
- provide a unique name in the Description box
- provide an IP address in the Hostname box
- Select a template of your preference and if no template matches the device, select Generic SNMP Device
- Select SNMP Version 2 from the dropdown box
- Set your SNMP Community and
- Click Create
Within a few seconds, a message box will appear as the image below with the success message.

Detailed information about adding the device will be found in the upper left-hand corner of the page.

¶ Create Graphs
To create graphs for the device just created, click on the “Create Graphs for this Device” link located in the upper right-hand corner of the page.

Select the port interface to be included in the graph from the list as shown in the image below.
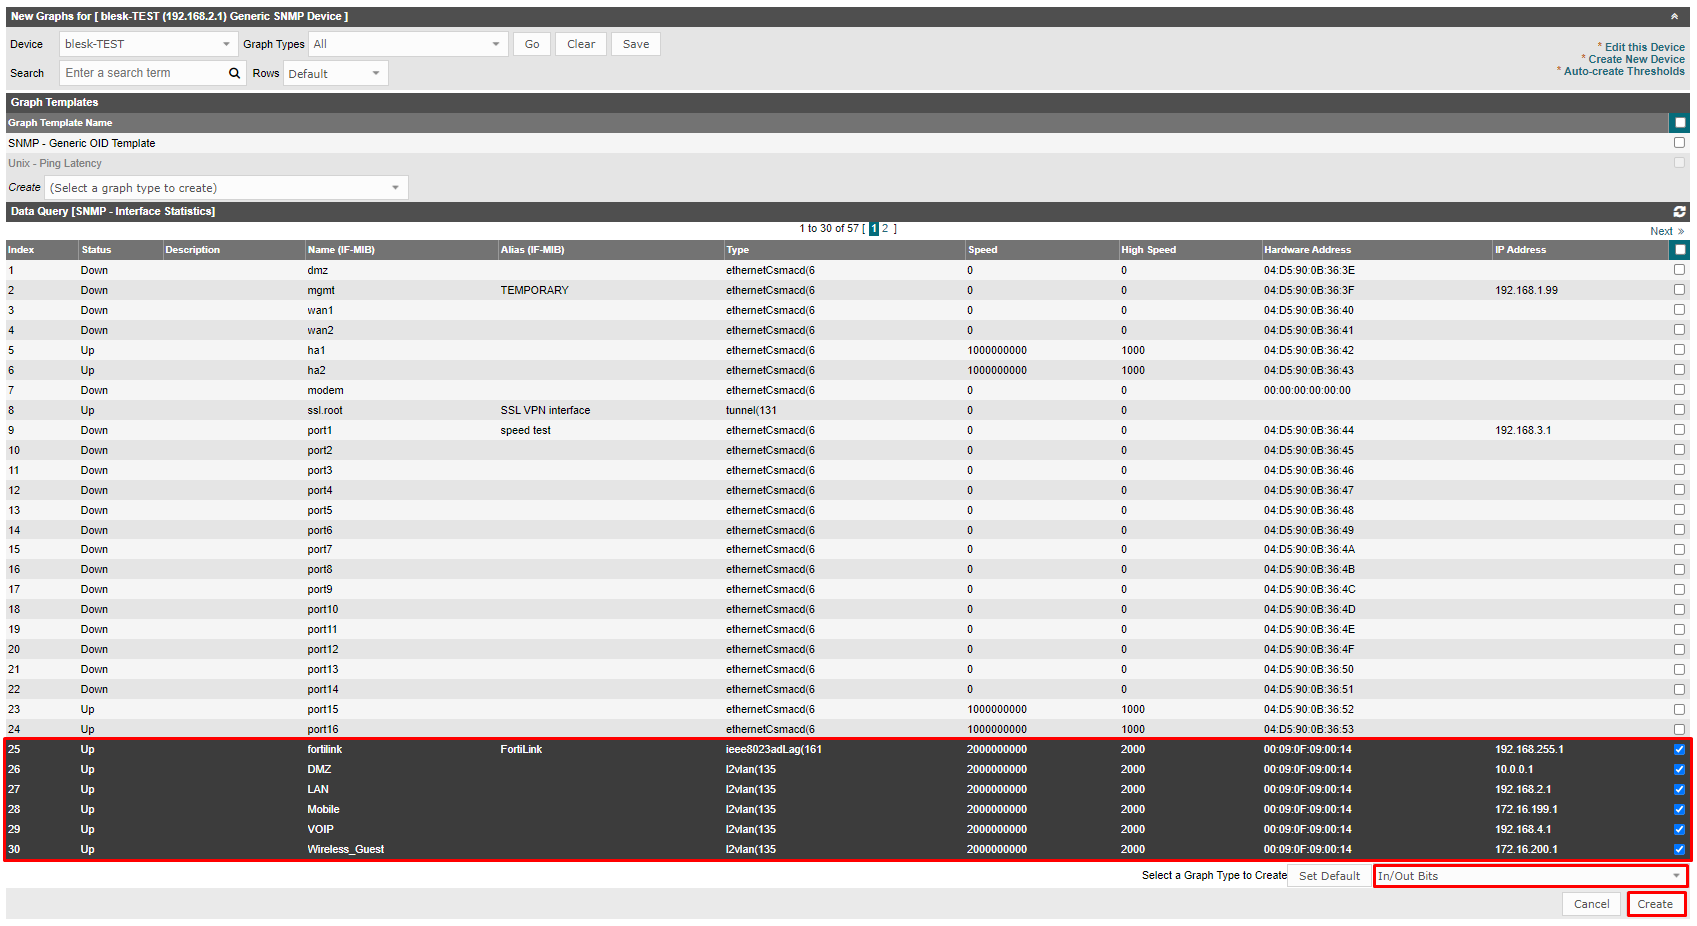
Select a graph type from the “Select a Graph Type to Create” dropdown menu from the bottom right-hand corner of the page. You may keep the default option (In/Out Bits) to begin with.
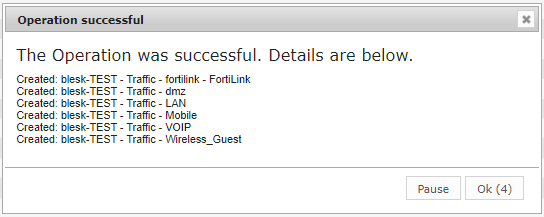
Click Create to continue. A confirmation message box will appear as the image below.
¶ Add a graph to the dashboard
To add the newly created graph to the dashboard, click on the “Devices” menu located under the Management section from the left menu bar.
Select the device from the list.
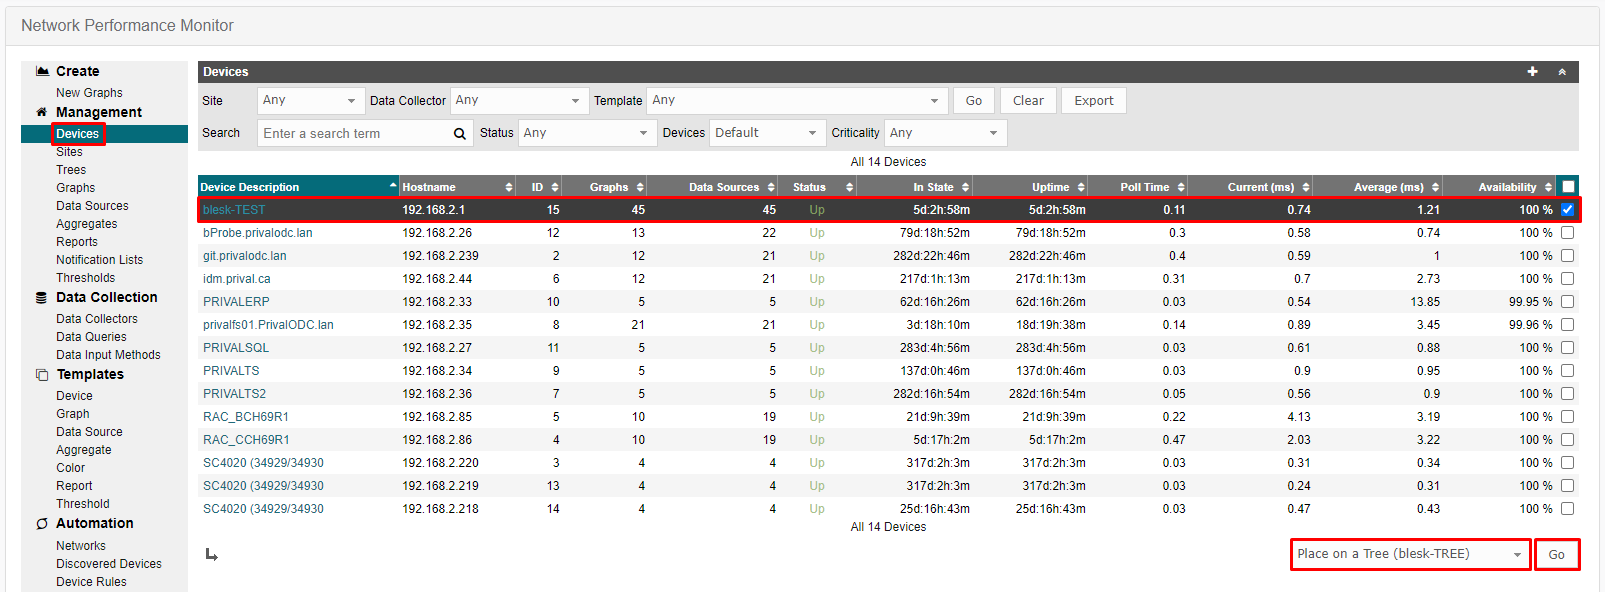
Define the tree from the dropdown menu in the lower right-hand corner and click Go to continue.

A message box will prompt with a confirmation message, click Continue to finish adding Graph to the Dashboard.
A success message will appear as the image below.

¶ View the Graph on the Dashboard
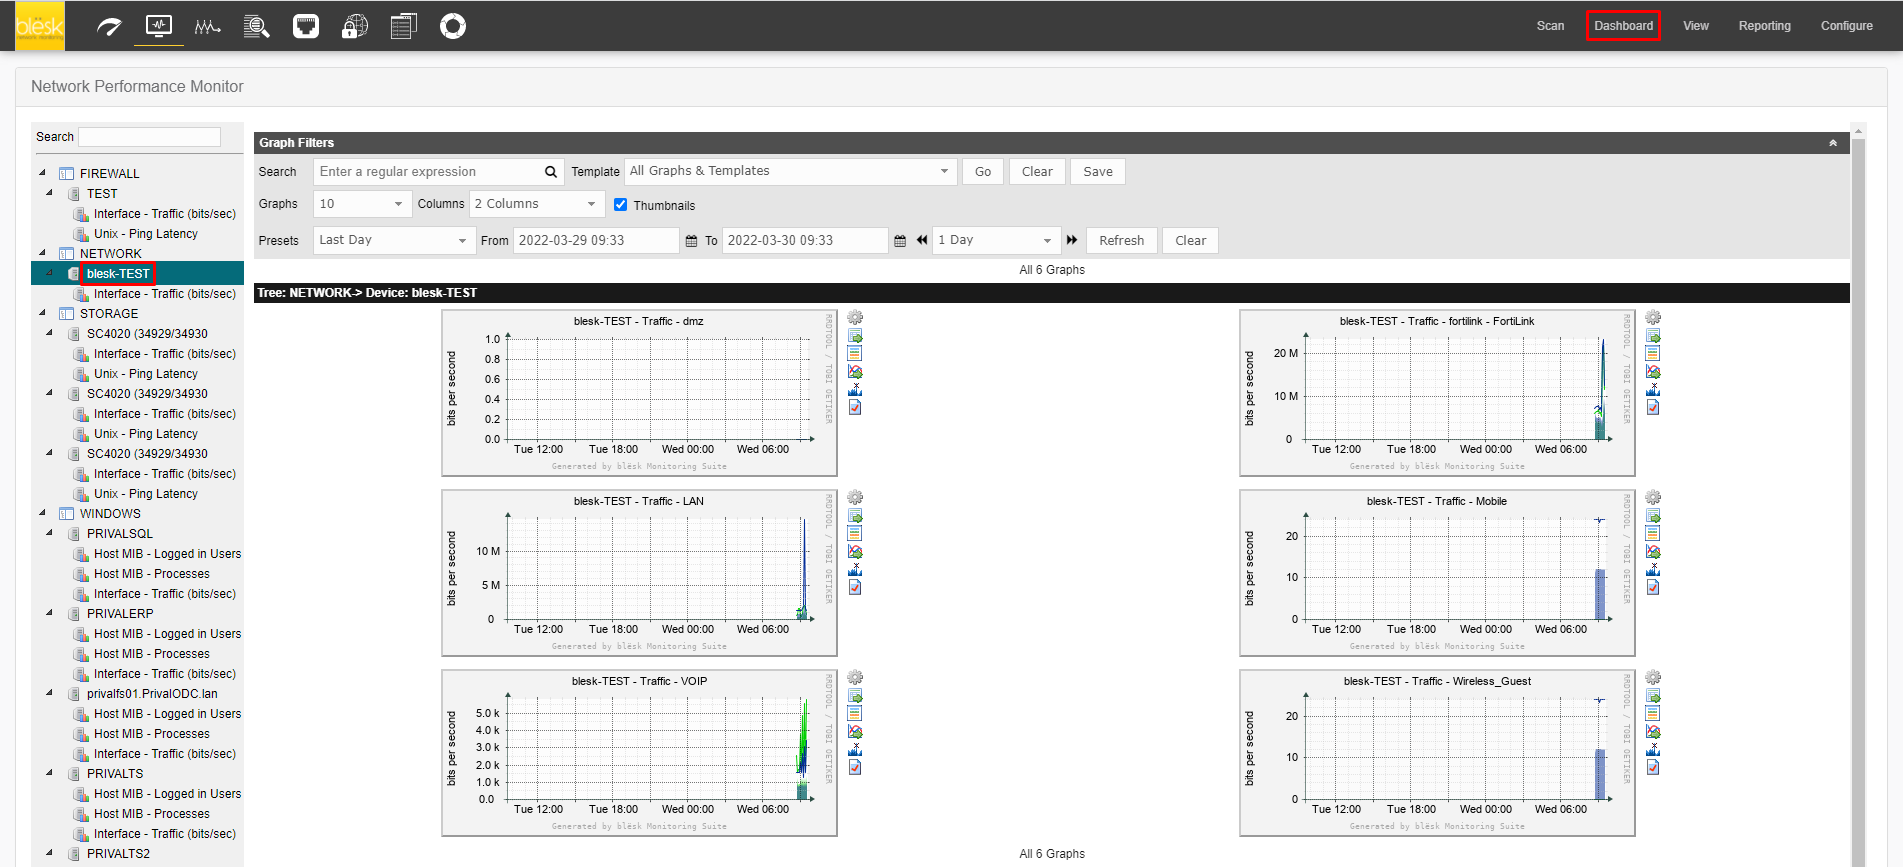
To view the newly added graph on the dashboard, click on the Dashboard menu from the top menu bar and select the graph from the left-hand menu.
Note: A 5 minutes pool is required for the graphs to start to appear.
¶ Trees
A Tree can be thought of as a hierarchical way of organizing graphs. Each Tree consists of zero or more branches that contain leaf nodes such as Graphs, Devices, and Sites. It's a very powerful way of organizing your Graphs.
Below we can see the current Trees that have been set up on our blësk server.

¶ Add a Tree
To add a Tree, navigate to the Trees page from the left-hand menu. The list of existing Trees is listed on this page.

Click on the “+” icon from the upper right-hand corner of the page.

Provide a name for the new Tree in the Name field and click “Create” to continue.
A confirmation message will appear as the image below.

Upon completion, the detailed page of the Tree will appear.
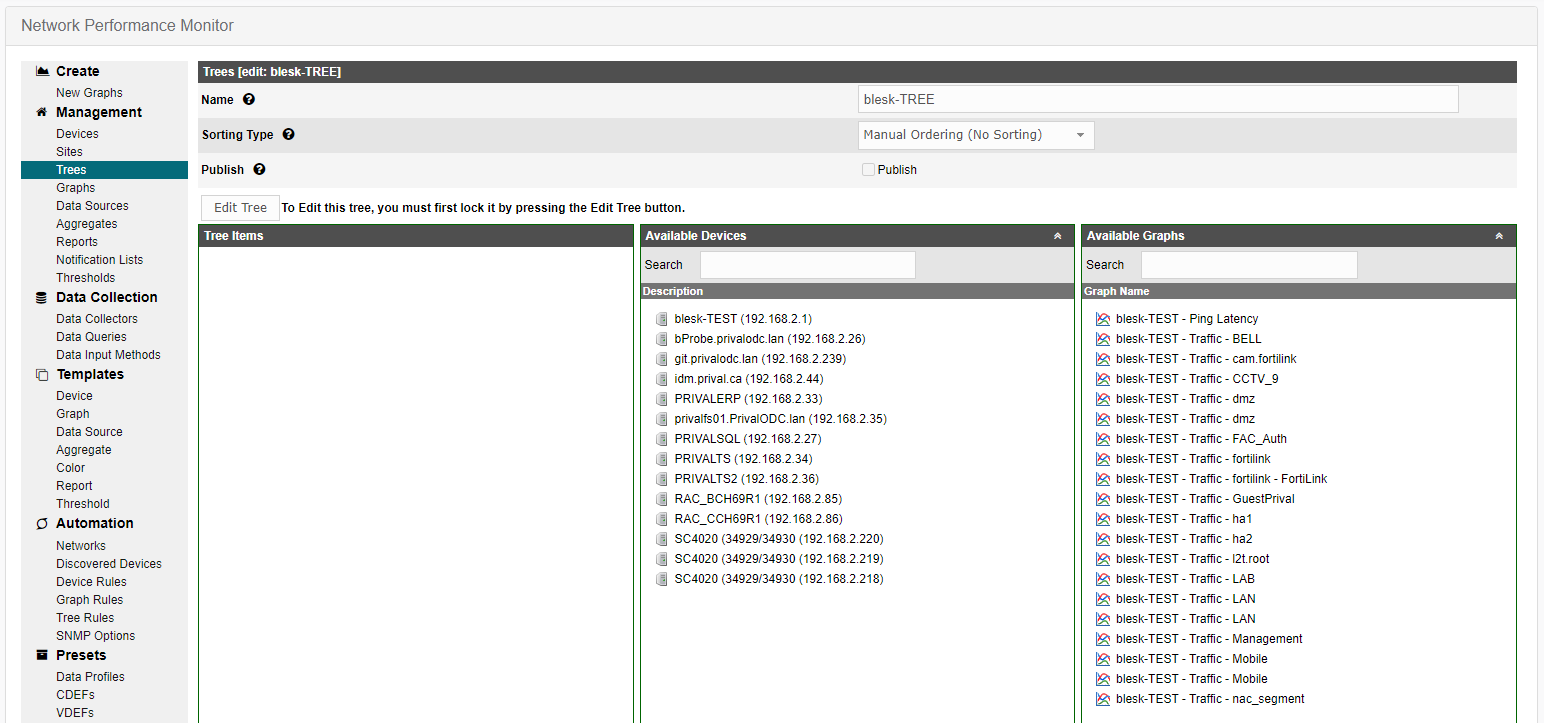
To add Tree Items, click on the Edit Tree button and add the Devices and Graphs to the Tree.

To add Devices and Graphs to the Tree, Drag Devices and Graphs need to be added from the list of Available Devices and Graphs and drop them into the Tree Items box.
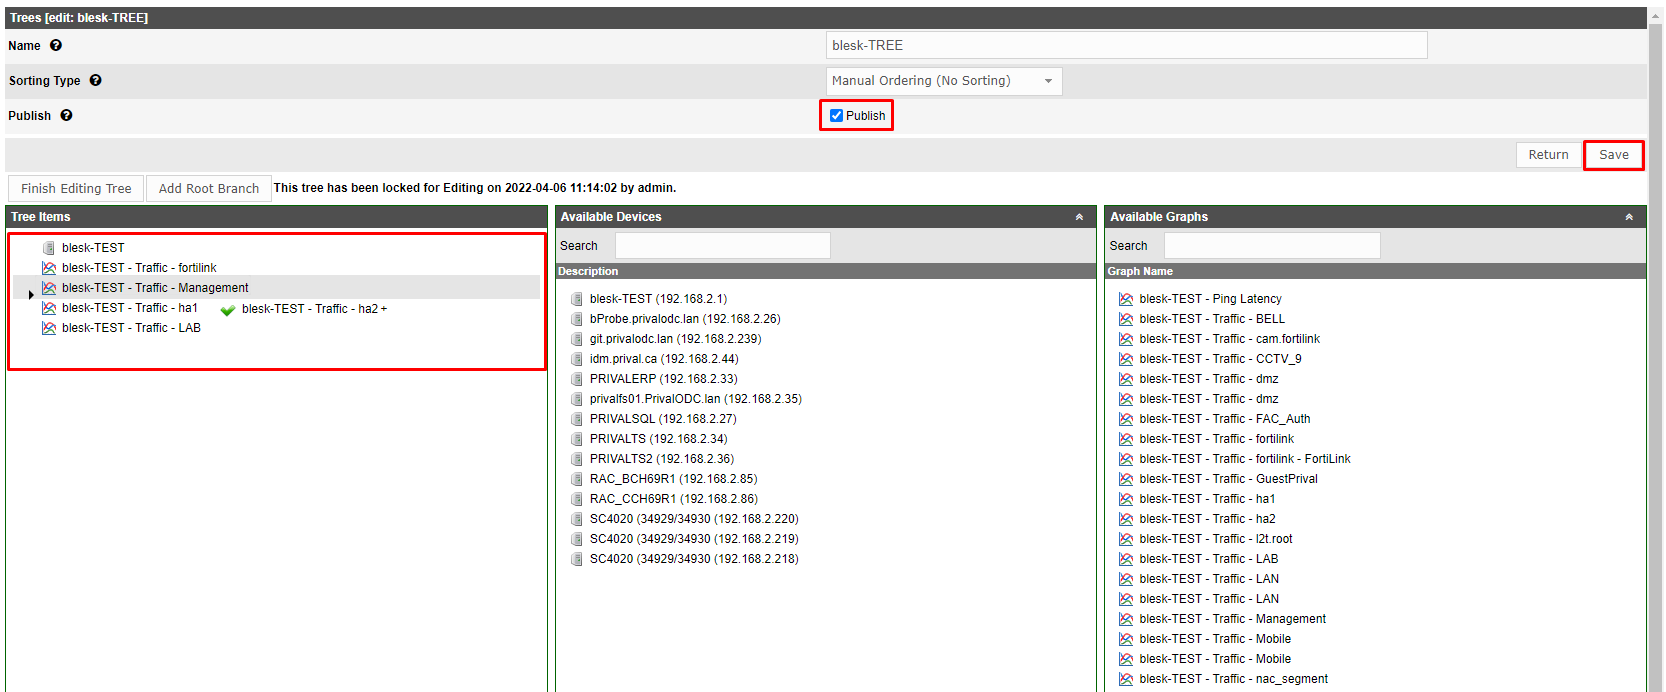
Check Publish and click the Save button to save the changes.
A message box will appear with the confirmation message.

The newly created tree should appear on the list.

To view the Graphs, navigate to the Dashboard by clicking the Dashboard menu from the top menu bar.
The newly added Device and Graphs will be found on this page.
