After logging into the NSM, Dashboard is the first page a user will see. The key functionalities of the dashboard are described below:
¶ Dashboard Displays
Many pages of the web interface show dashboard displays on the top of the page depending on the page content.
There are two types of dashboard displays: charts and tables.
For each page, there is a default setting of displays. The default setting can be restored by clicking on the right side above the displays.
¶ Adding and Deleting Dashboard Displays
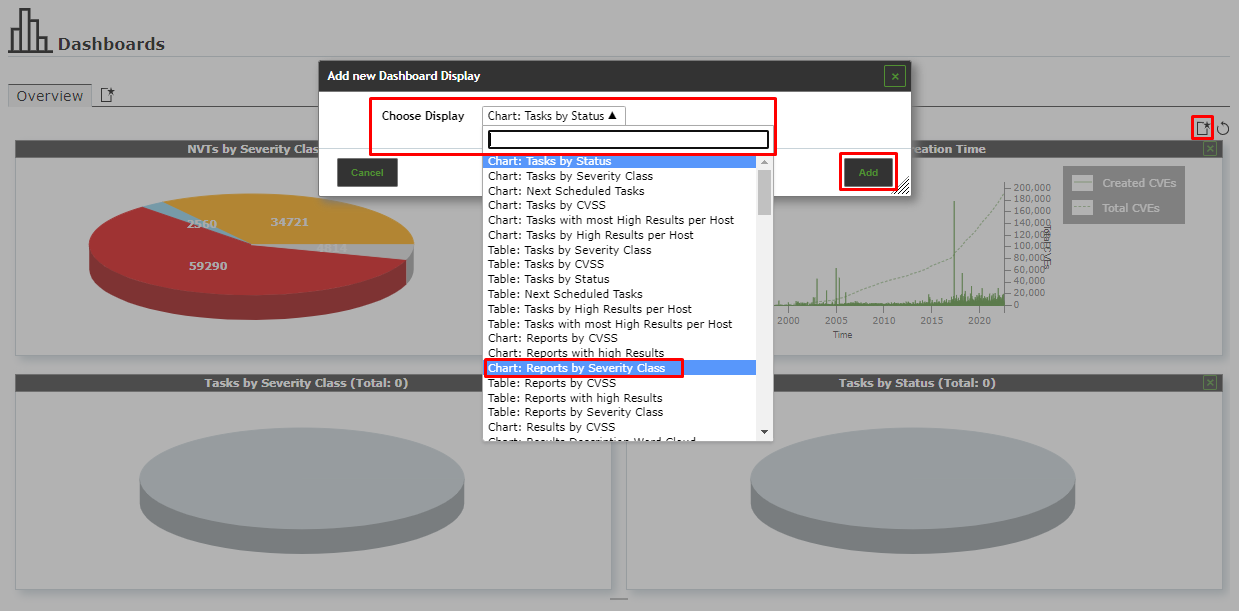
A new display can be added by following the steps below:
- Click on the right side above the displays.
- Select the desired display in the drop-down list
- Click Add button.
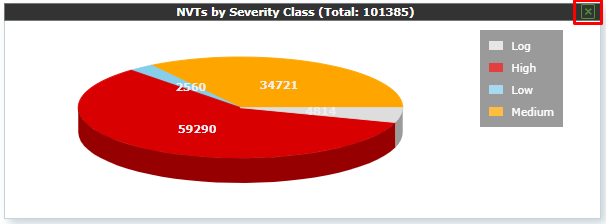
A display can be deleted by clicking in the upper right corner of the display.
¶ Editing a Dashboard Display
Depending on the display there are several options that can be selected by moving the mouse to the right edge of a display
- Apply a filter to the display. The filter has to be configured for the object type shown in the display.
- Download the chart as an SVG file (only for charts).
- Download the table as a CSV file (only for tables).
- Hide or show a legend (only for charts).
- Switch between 2D and 3D presentation (only for charts).

¶ Organizing Displays in Dashboards
Dashboard displays can be summarized into dashboards. They can be individual compilations of displays but there are predefined dashboards which can be chosen as well.
There can be up to 10 dashboards.
By default, there is only the overview dashboard giving a short overview of tasks, CVEs and NVTs
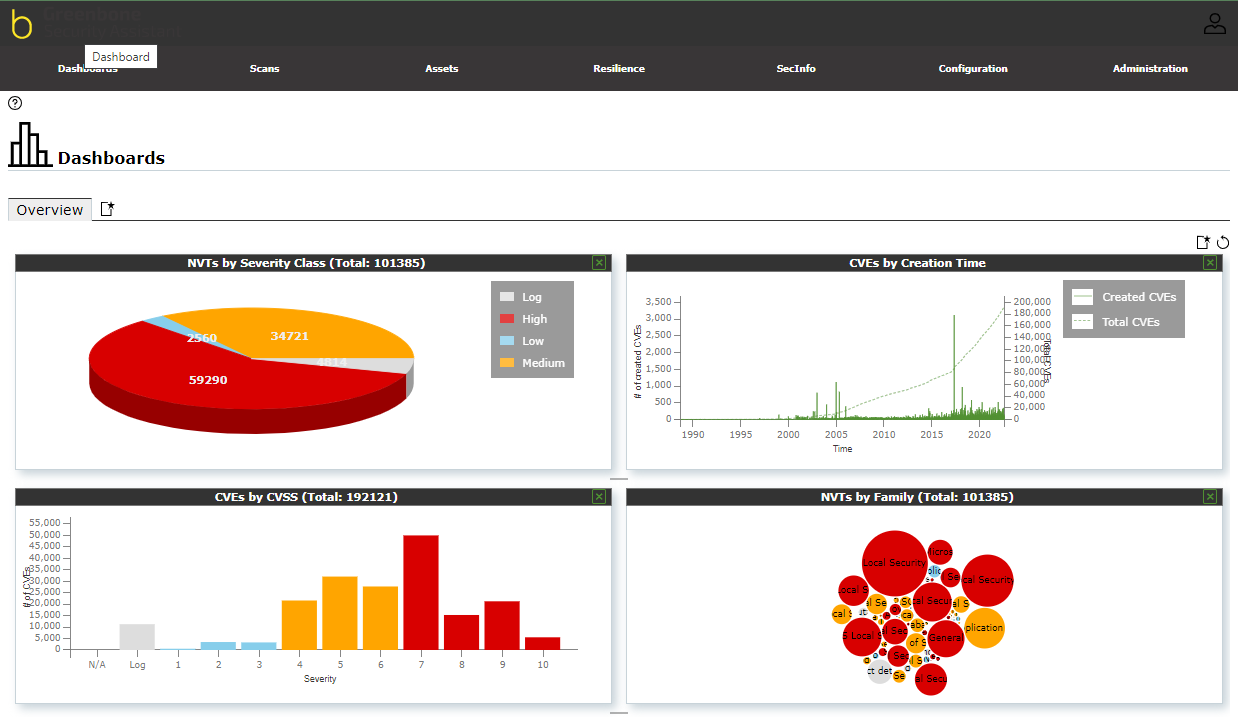
The dashboards are displayed by selecting Dashboards in the menu bar.
¶ Adding a New Dashboard
A new dashboard can be created as follows:
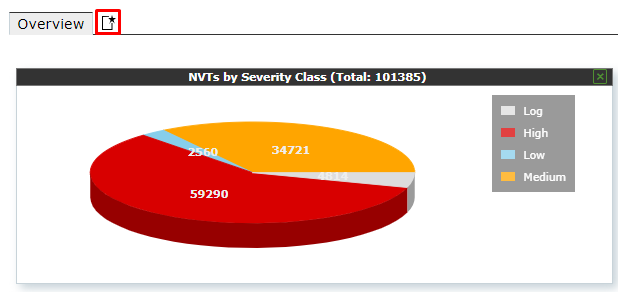
1. Click Create button located at the upper left-hand corner of the dashboard as shown in Image - 5.
2. Enter the name of the dashboard in the input box Dashboard Title.
3. Select the displays that should be shown by default in the drop-down list Initial Displays.
The following default settings for the shown displays are possible:
- Default: the dashboard contains the same displays as the overview dashboard.
- Scan Displays: the dashboard contains displays concerning tasks, results and reports.
- Asset Displays: the dashboard contains displays concerning hosts and operating systems.
- SecInfo Displays: the dashboard contains displays concerning VTs, CVEs, and CERT-Bund Advisories.
- Empty: the dashboard contains no displays.
Additionally, already existing dashboards can be chosen.

4. Click Add.
The dashboard is added and shown as a new tab on the dashboard title bar.

¶ Editing a Dashboard
A dashboard can be edited by following the steps below:
Click on the Edit icon on the Dashboard tab as shown in the image below:

Change the name in the input box Dashboard Title.
Click Save.
¶ Deleting a Dashboard
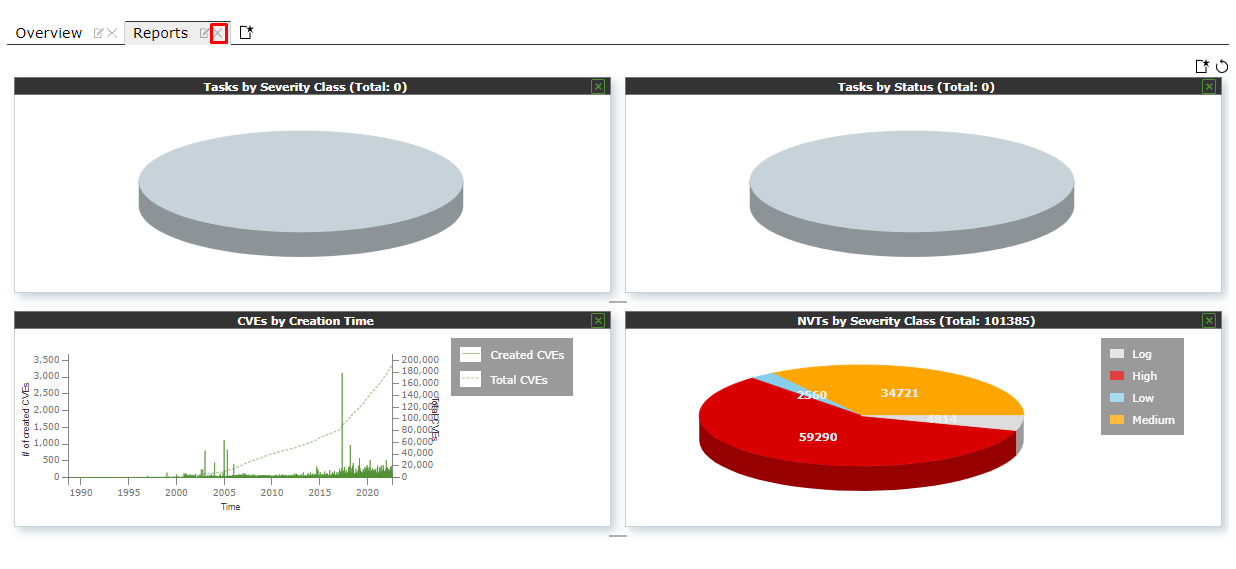
A dashboard can be deleted by clicking on the delete button of the dashboard tab.
