¶ Remediation Ticket
Remediation tickets are used to resolve the findings of vulnerabilities. Tickets can be assigned to the current user or other users. All valuable information to understand and resolve the problem is directly cross-linked and available for the assigned user.
All tickets have a specific status (e.g., open, fixed) to track the progress.
Additionally, alerts can be assigned for certain events considering tickets, e.g., a status change of an assigned ticket.
Enter a note for the ticket in the input box Note.
¶ Compliance Policies
¶ Creating a Policy
A new policy can be created as follows:
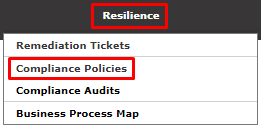
1. Select Resilience > Compliance Policies in the menu bar.
2. Create a new policy by clicking 
3. Enter the name of the policy in the input box Name

4. Click Save.
⇒ The policy is created and displayed on the page Policies.
¶ Editing Policy
1. In the row of the policy click  .
.
2. In the sections, Edit Network Vulnerability Test Families select the radio button  if newly introduced VT families should be included and activated automatically
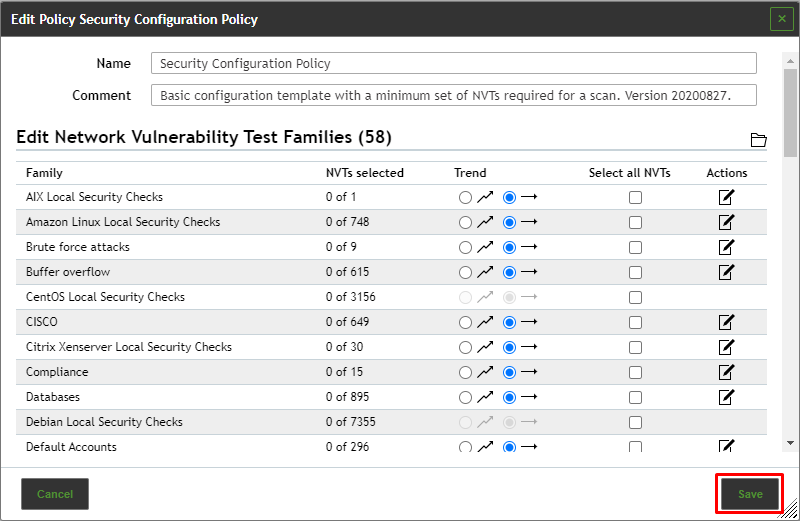
3. In the section Edit Network Vulnerability Test Families activate the checkboxes in the column Select all NVTs if all VTs of a family should be activated.
4. Click  for a VT family to edit it.
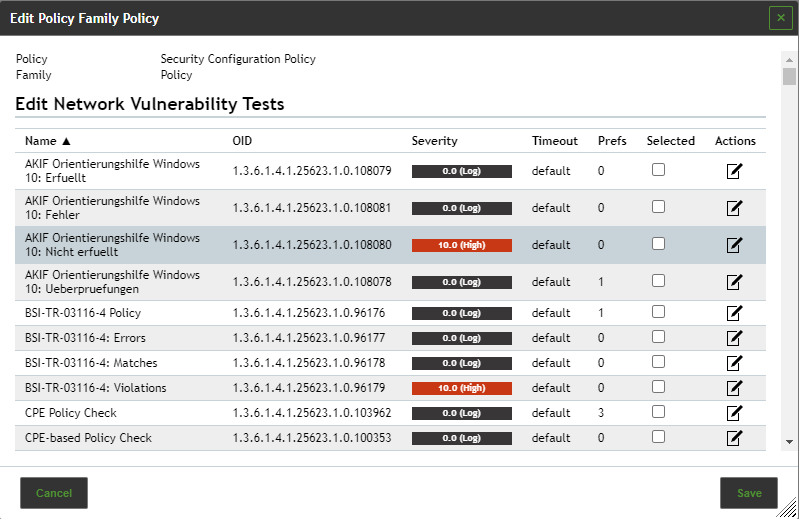
5. In the column Selected activate the checkboxes of the VTs that should be activated.
6. Click  for a VT to edit it
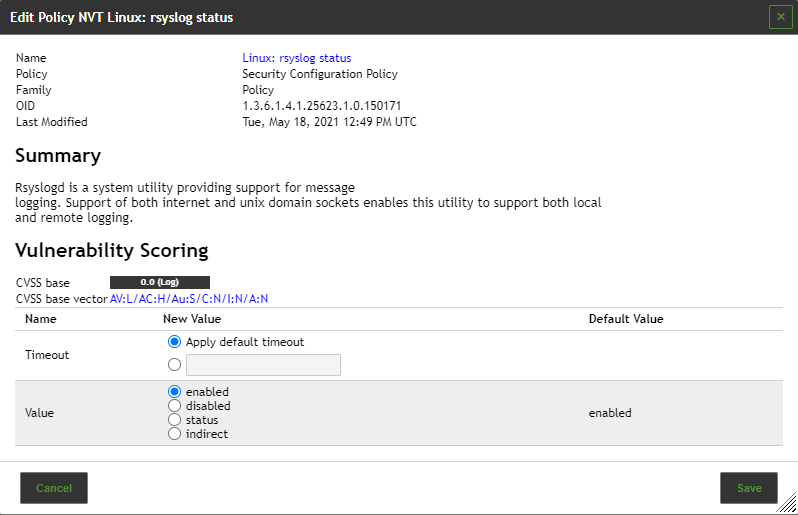
7. Click Save to save the VT.
8. Click Save to save the family of VTs.
9. Optional: edit scanner preferences.
10. Optional: edit VT preferences.
11. Click Save to save the policy.
¶ Importing a Policy
A policy can be imported as follows:
1. Select Resilience > Compliance Policies in the menu bar.
2. Click 
3. Click Browse… and select the XML file of the policy

4. Click Import.
⇒The imported policy is displayed on the page Policies.
¶ Managing Policies
List Page
All existing policies can be displayed by selecting Resilience > Compliance Policies in the menu bar.
Name
Name of the policy.
For all policies the following actions are available:
 Move the policy to the trashcan. Only policies that are currently not used can be moved to the trashcan. As long as the policy is not deleted from the trash can, it is not downloaded a new one during the next feed update.
 Edit the policy. Only self-created policies which are currently not used can be edited.
 Clone the policy.
 Create a new audit for the policy.
 Export the policy as an XML file.
¶ Compliance Audits
¶ Creating an Audit
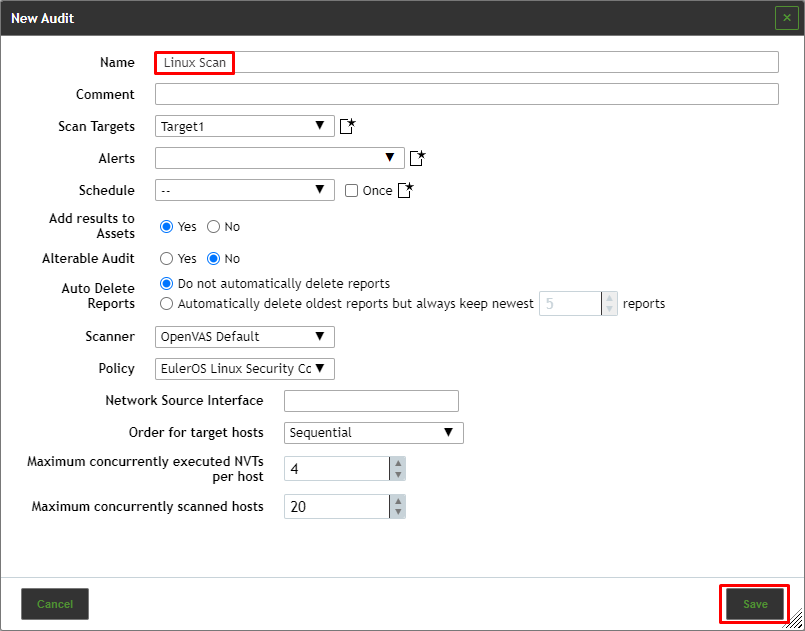
An audit can be created on the page Audits as follows:
Select Resilience > Compliance Audits in the menu bar.
Create an audit by clicking  .
.
Define the audit.
Click Save.
⇒ The audit is created and displayed on the page Audits.
The following information can be entered:
Name
The name can be chosen freely. A descriptive name should be chosen if possible.
Comment
The optional comment allows for the entry of background information. It simplifies understanding the configured audit later.
Scan Targets
Select a previously configured target from the drop-down list.
Additionally, the target can be created on the fly by clicking  next to the drop-down list.
Alerts
Select a previously configured alert from the drop-down list. Status changes of an audit can be communicated via e-mail, Syslog, HTTP or a connector.
Additionally, an alert can be created on the fly by clicking  next to drop-down list.
Schedule
Select a previously configured schedule from the drop-down list. The audit can be run once or repeatedly at a predetermined time, e.g., every Monday morning at 6:00 am.
Additionally, a schedule can be created on the fly by clicking  next to the drop-down list.
Add results to Assets
Selecting this option will make the systems available to the asset management of the NSM automatically. This selection can be changed at a later point as well.
Alterable Audit
Allow for modification of the audit even though reports were already created. The consistency between reports can no longer be guaranteed if audits are altered.
Auto Delete Reports
This option may automatically delete old reports. The maximum number of reports to store can be configured. If the maximum is exceeded, the oldest report is automatically deleted. The factory setting is Do not automatically delete reports.
Policy
The NSM comes with four pre-configured policies.
Network Source Interface
Here the source interface of the NSM for the scan can be chosen.
Order for target hosts
Select in which order the specified target hosts are processed during vulnerability tests. Available options are:
- Sequential
- Random
- Reverse
In order to improve the scan progress estimation, the setting Random is recommended.
Maximum concurrently executed NVTs per host/Maximum concurrently scanned hosts
Select the speed of the scan on one host. The default values are chosen sensibly. If more VTs run simultaneously on a system or more systems are scanned at the same time, the scan may have a negative impact on either the performance of the scanned systems or the network.
¶ Creating an Audit Through a Policy
An audit can directly be created for a policy as follows:
1. Select Resilience > Compliance Policies in the menu bar.
2. In the row of the desired policy click  .
.
⇒ The policy is already selected in the drop-down list Policy.
3. Define the audit.
4. Click Save.
⇒The audit is created and displayed on the page Audits.
¶ Starting an Audit
In the row of the newly created audit click  .
.
The report of an audit can be displayed as soon as the audit has been started by clicking the bar in the column Status.
As soon as the status changes to Done the complete report is available. At any the time, the intermediate results can be reviewed.
¶ Managing Audits
List Page
All existing audits can be displayed by selecting Resilience > Compliance Audits in the menu bar.
For all audits the following information is displayed:
Name
Name of the audit. The following icons may be displayed:
 The audit is marked as alterable. Some properties that would otherwise be locked once reports exist can be edited.
 The audit is configured to run on a remote scanner.
 The audit is visible to one or more user(s).
 The audit is owned by another user.
Report
Date and time of the latest report. By clicking it the details page of the latest report is opened.
¶ Using and Managing Policy Reports
Reports for audits are similar to reports of all other tasks.
Once a scan has been started, the report of the results found so far can be viewed. When a scan is completed, the status changes to Done and no more results will be added.
¶ Exporting a Policy Report
The policy report can be downloaded from the page Audits as follows:
- Select Resilience > Compliance Audits in the menu bar.
- In the row of the desired audit click
 .
. - Download the PDF file.
¶ Generic Policy Scans
When performing policy scans, there are groups of four VTs in the VT family Policy that can be configured accordingly.
At least the base VT and one additional VT are required to run a policy scan.
The four VT types are:
Base
This VT performs the actual scan of the policy.
Errors
This VT summarizes any items in which some errors occurred when running the base VT.
Matches
This VT summarizes any items which match the checks performed by the base VT.
Violations
This VT summarizes any items which did not match the checks performed by the base VT.
¶ Business Process Maps
A Business Process Map (BPM) is used to illustrate the impact of collected results on a business.
Business processes are modeled using nodes (= processes) and edges (= connections).
Each node is assigned to the host on which the process takes place. The node is colored according to the highest severity of the host.
The following colors are possible:
- Red: one or more host(s) has/have the severity High
- Yellow: one or more host(s) has/have the severity Medium but no host has a higher severity
- Blue: one or more host(s) has/have the severity Low but no host has a higher severity
- Light gray: one or more host(s) has/have the severity Log but no host has a higher severity
- Dark gray: no severities are available for the host(s) (N/A)
- White: no hosts are associated with this process
If a process is vulnerable and may affect the following process, the coloration of this following process is adjusted.
By this, it is possible to detect the vulnerabilities of processes and their impact on subsequent processes.
The following rules apply for the color overriding:
- Higher severities override lower severities: High > Medium > Low > Log
- Log does not override the missing assignment of hosts
- N/A does not override Log
Loading and saving the BMP is completely automatic. The map is loaded when the page Business Process Map is opened. Changes are saved as soon as they are done.
The BPM cannot be shared or exported/imported.
¶ Creating a Business Process Map
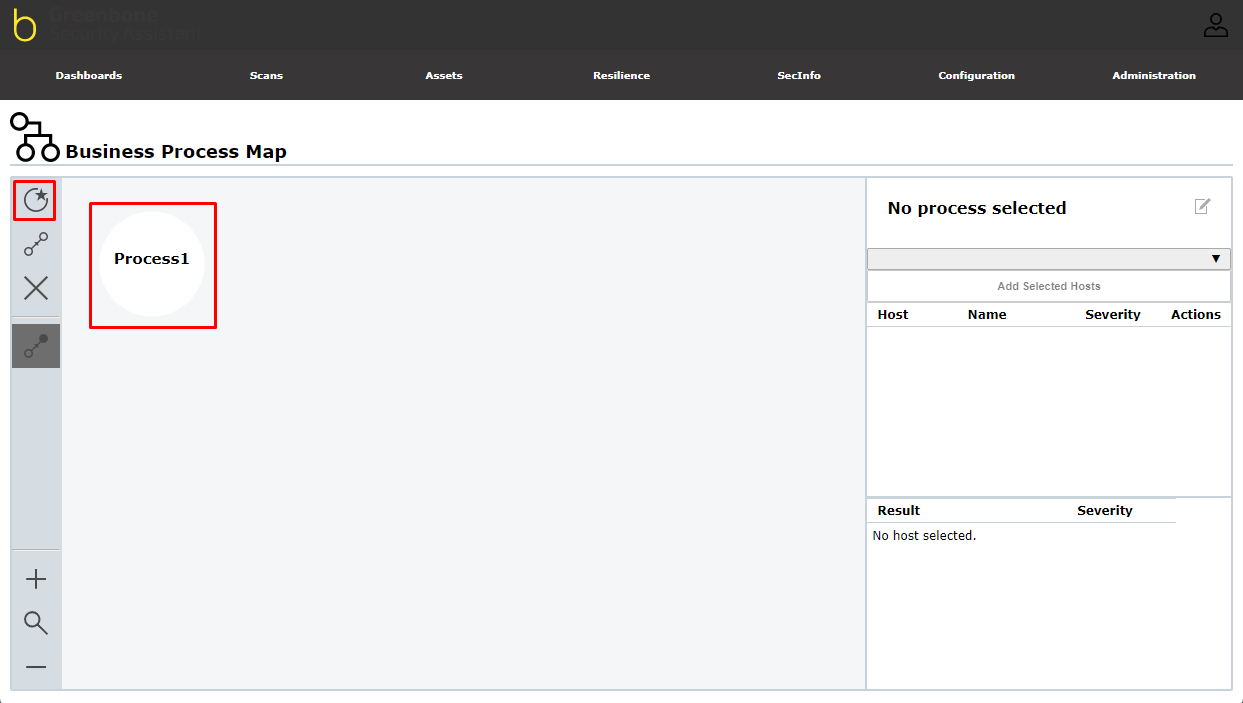
- Select Resilience > Business Process Map in the menu bar.
- Click
 to create a process node.
⇒ The process node is created and displayed on the map.
For each process, a standard tag is created on the page Tags. The name of the tag corresponds to the name of the process, preceded by “myBP:”. If the process is renamed, the tag’s name is changed as well, while the tag’s ID remains the same.
3. Select the process node by clicking it.
⇒ The node is marked by a blue border.
4. Select the hosts that should be assigned to the process in the drop-down list
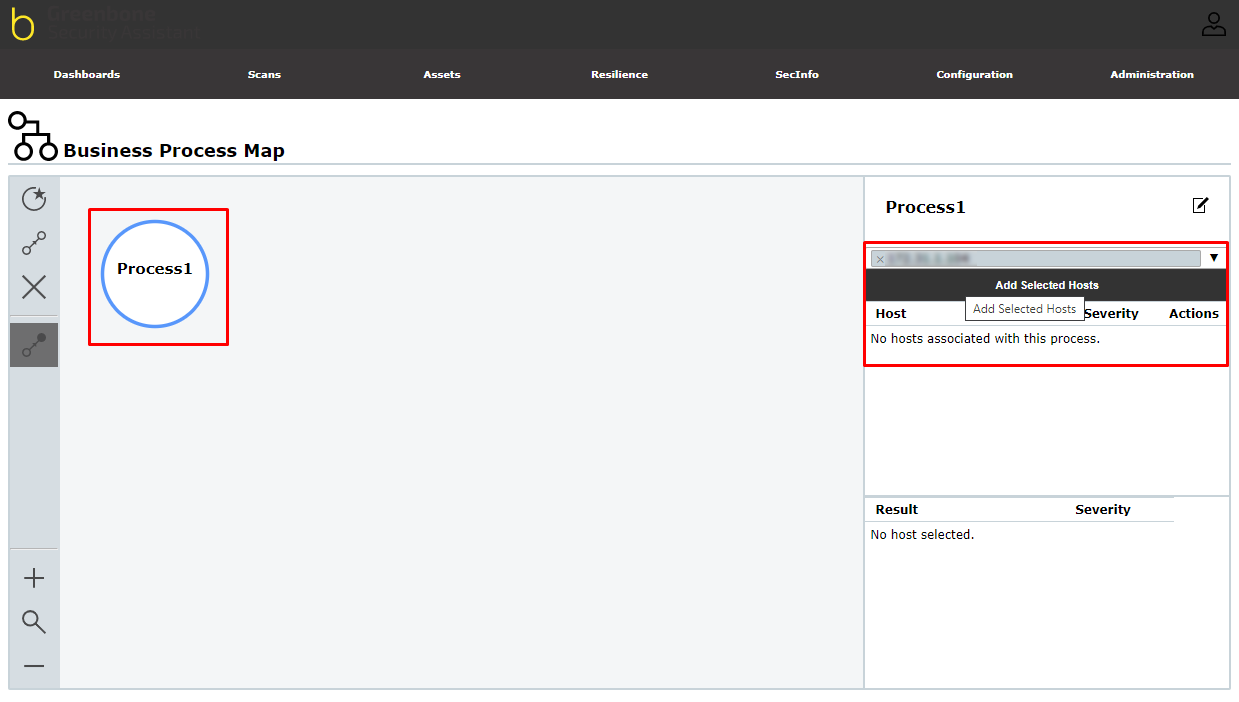
5. Click Add Selected Hosts.
⇒ The process node is colored according to the host’s highest severity.
When the process node is selected, the hosts are displayed in the table on the right.
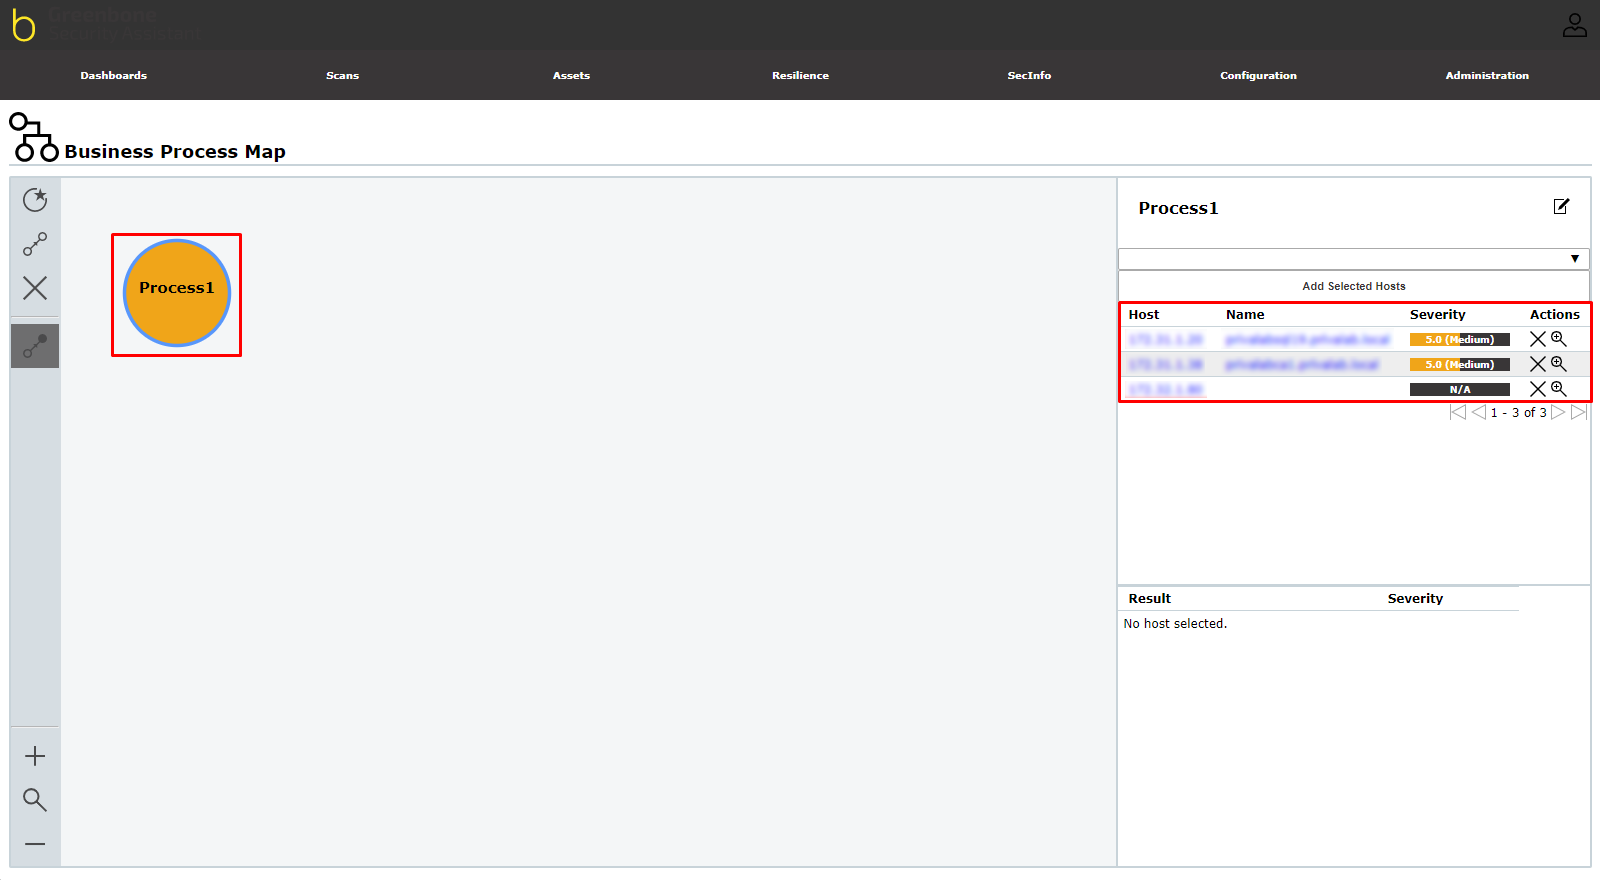
By clicking  the details page of the host is opened.
By clicking on a host, the results found for these hosts are displayed in the table below. Clicking on a result opens its details page.
6. Create a second (or more) process node(s) (see steps 2 – 5).
7. Click  to create a new connection.
⇒ The “draw” mode is activated.
8. Click the source process node.
⇒ The node is marked by a blue border.
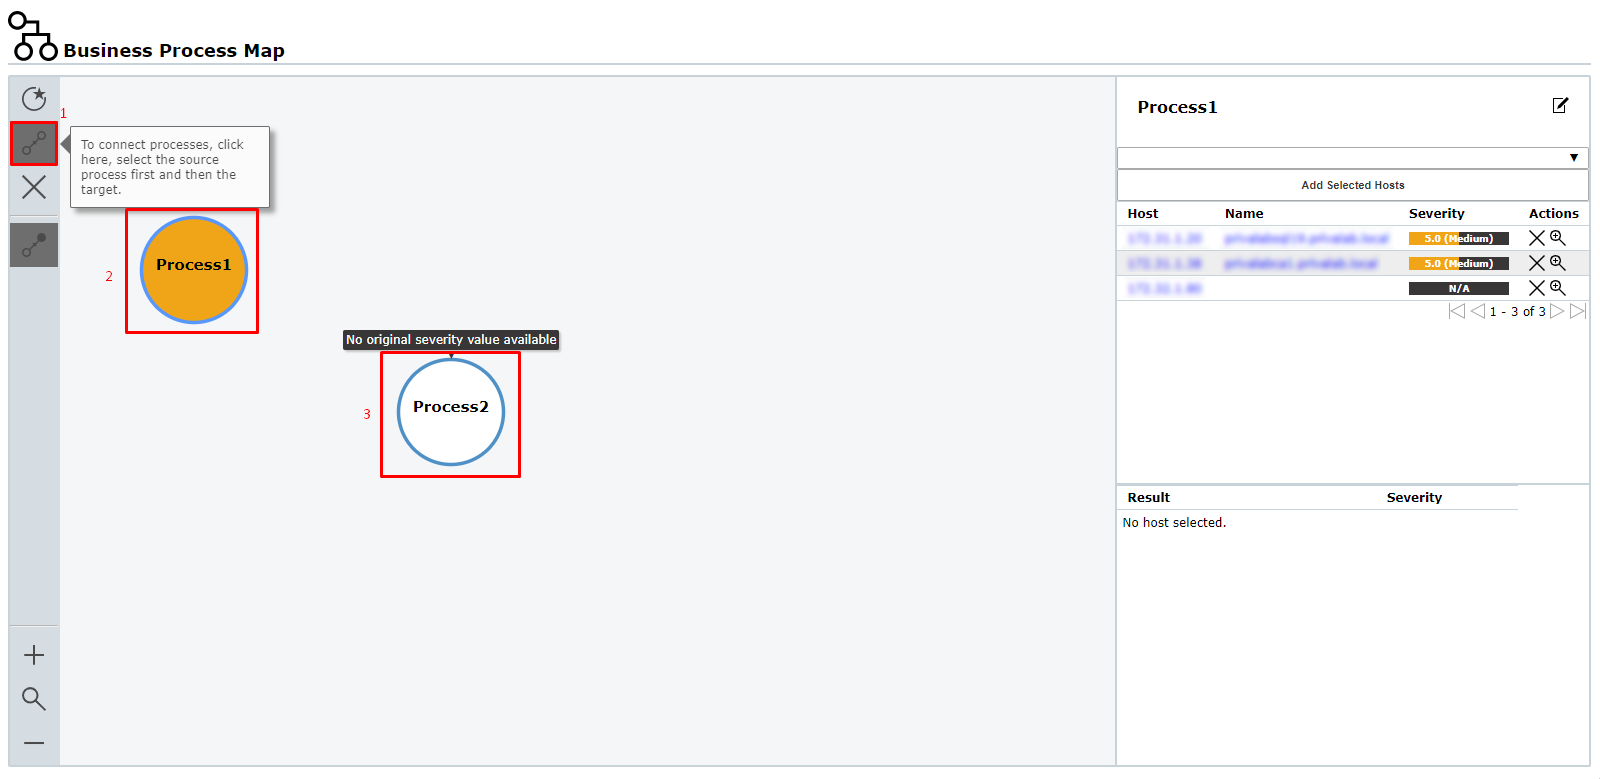
9. Click the target process node.
⇒The connection is created. The arrow indicates the direction of influence
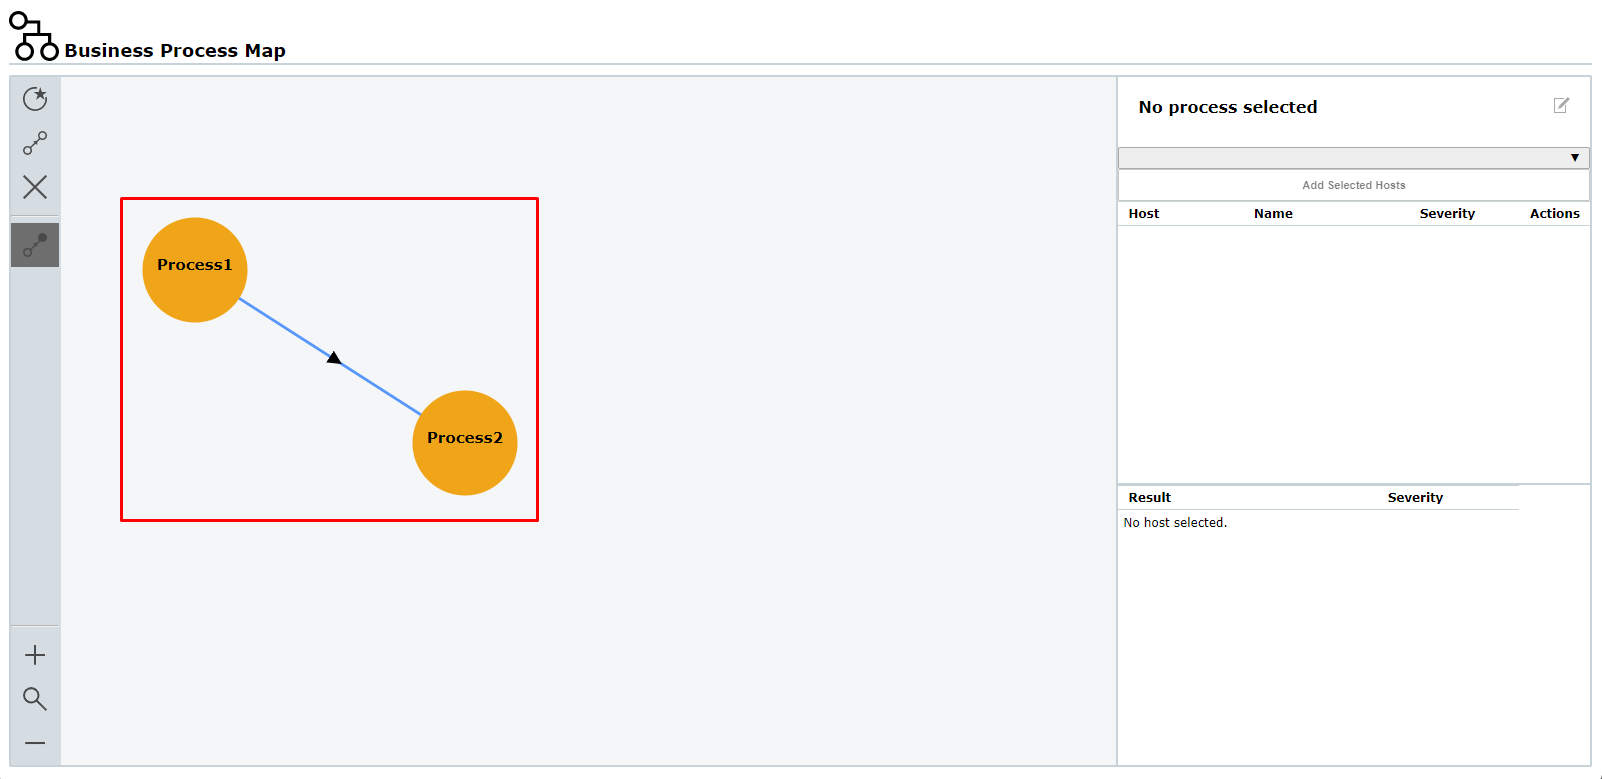
The color of the primary process is assigned to the following process(es) as well, i.e., the color of the following process node(s) is the same as that of the primary process node. A tooltip shows the original severity of the process.