¶ Overview
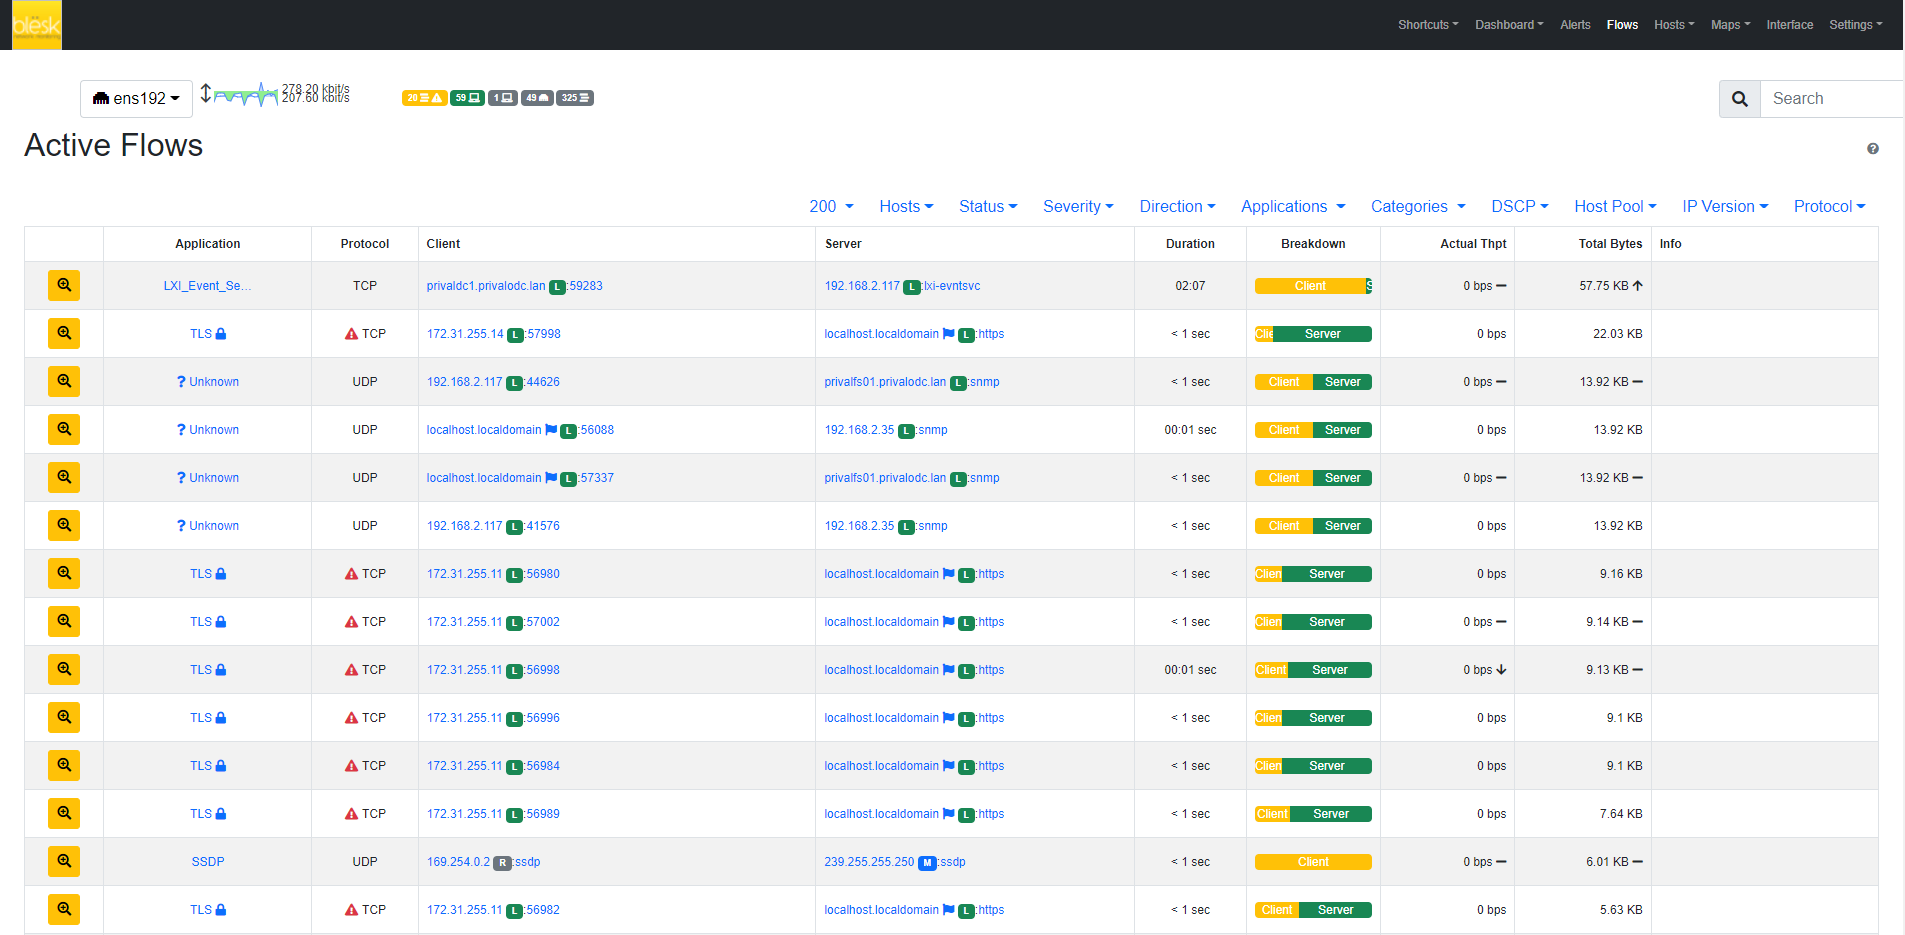
The ‘Flows’ entry in the top toolbar can be selected to visualize realtime traffic information on the currently active flows. A flow can be thought of as a logical, bi-directional communication channel between two hosts. Multiple simultaneous flows can exist between the same pair of hosts.

Flows are uniquely identified via a 5-tuple composed of:
- Source and destination IP address
- Source and destination port
- Layer-4 protocol
Each flow is shown as a row entry in the flows table. Flows are sortable by application using the rightmost dropdown menu at the top right edge of the table. Similarly, the other dropdown menu enables the user to choose the number of flows displayed on each page.
Flows have multiple information fields, namely, Application, Layer-4 Protocol, Client and Server hosts, Duration, Client and Server Breakdown, Current Throughput, Total Bytes, and Additional Information. Information fields are briefly discussed below.
¶ Detailed Flow Information
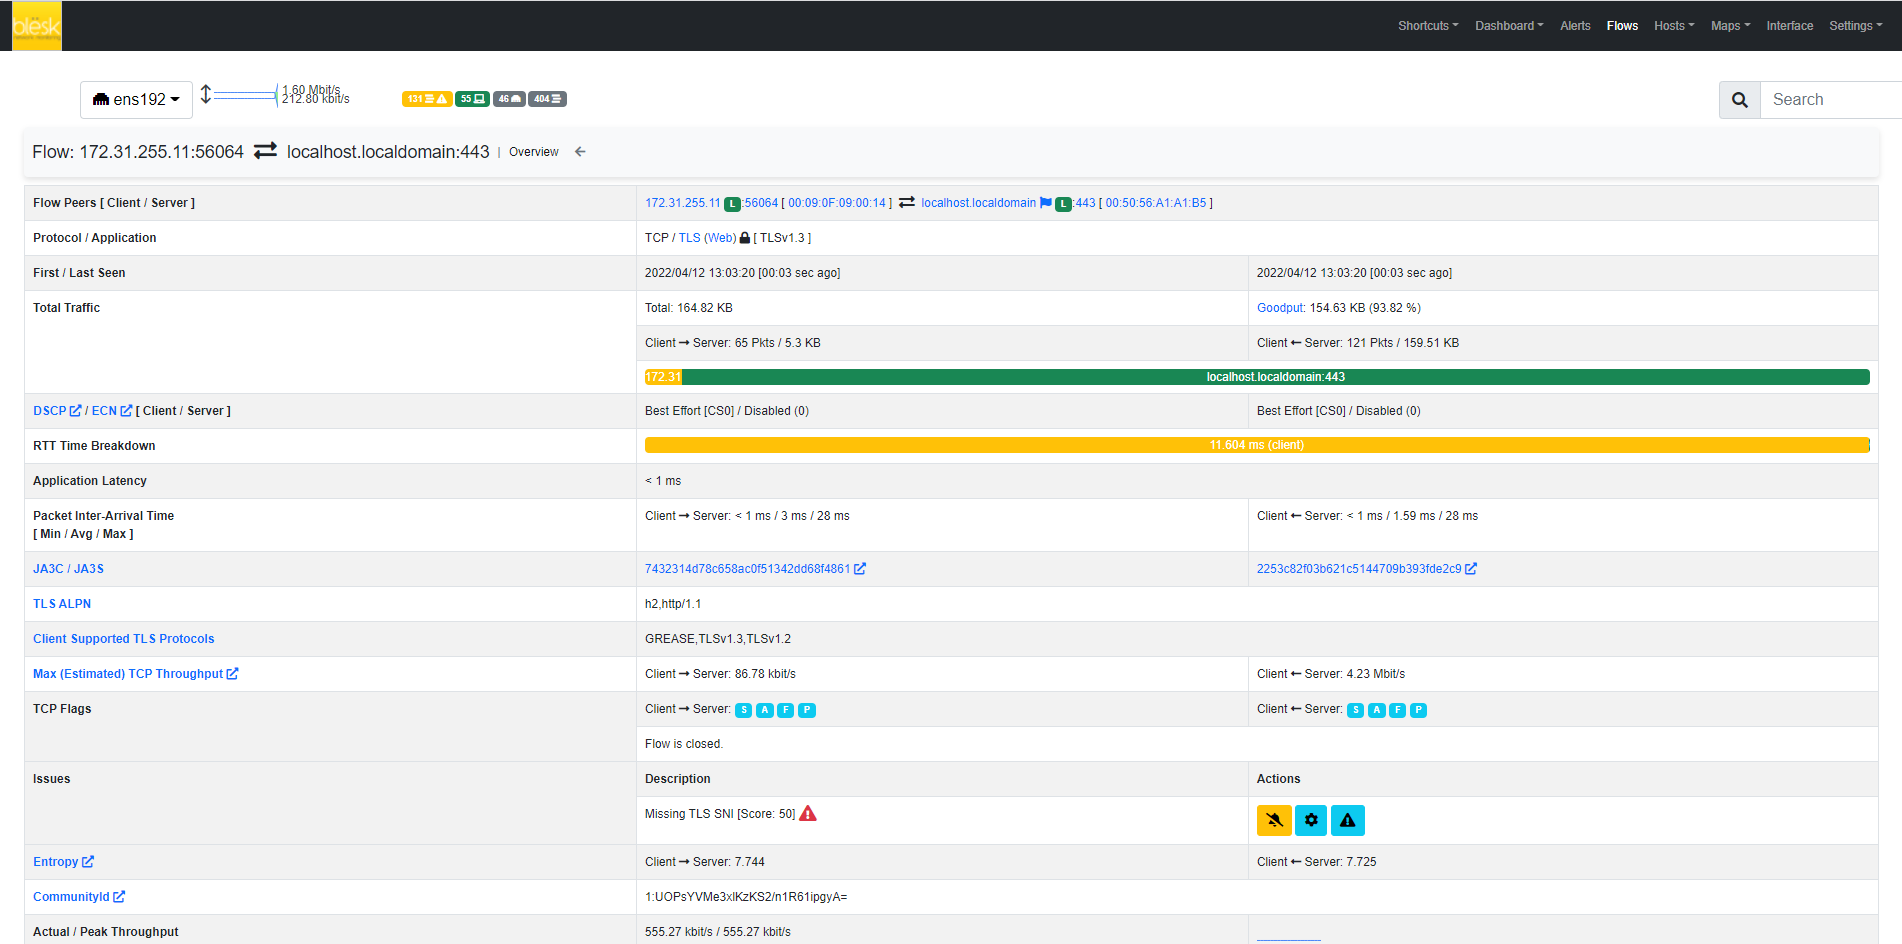
By clicking the lens image at the beginning of the flow, it’s possible to jump to the detailed flow information. Here all the information blësk NTA has about the flow, are going to be displayed.

¶ Application
Application is the Layer-7 program which is exchanging data through the flow. This is the piece of software that lays closest to the end user. Examples of Applications are Skype, Redis, HTTP, and Bit Torrent. Layer-7 applications are detected by the open source Deep Packet Inspection (DPI) engine. In case application detection fails, blësk NTA marks the flow as ‘Unknown’. If the detection succeeds, the application name and an informative icon are shown.
Here is a list of possible informative icons:
- The lock icon tells that the protocol carries information in a secure way (e.g. via SSL)
- The thumb-up icons tells that the protocol is generally not harmful for network performance
- The thumb-down icons tells that the protocol is generally harmful for network performance
- The smile face tells that the protocol is generally used for user entertainment
- The yellow triangle indicates a possible problem on the flow. By clicking a flow details it’s possible to see what the reported problem is (e.g. flow with low goodput)
The application name can be clicked to see all hosts generating traffic for the application.
¶ Protocol
The protocol is the one used at the transport level. Most common transport protocol are the reliable Transmission Control Protocol (TCP) and the best-effort User Datagram Protocol (UDP).
¶ Client
This field contains host and port information regarding the client endpoint of the flow. A host is considered a client if it is the initiator of the flow. Information is shown as host:port and both information are clickable. If the host has a public IP address, blësk NTA also shows the country flag for that client. A blue flag is drawn when the host is the blësk NTA host.
¶ Server
Server field contains information regarding the server endpoint of the flow. A host is considered a server if it is not the initiator of the flow.
¶ Duration
This is the amount of time that has elapsed since the flow was opened by the client.
¶ Breakdown
Flows are bi-directional, in the sense that traffic flows both from the server to the client and from the client to the server. This colored bar gives an indication of the amount of traffic exchanged in each of the two directions. Client to server traffic is shown in orange, while server to the client is in blue.
¶ Actual Throughput
The throughput is computed periodically (the refresh time is a few seconds).
¶ Total Bytes
The amount of traffic exchanged thought the flow. This total value is the sum of traffic exchanged in each of the two directions (client to server and server to client).
¶ TLS Information
blësk NTA provides detailed information on TLS flows.

- The TLS certificate requested by the client and the server names returned by the server
- The TLS certificate validity time frame
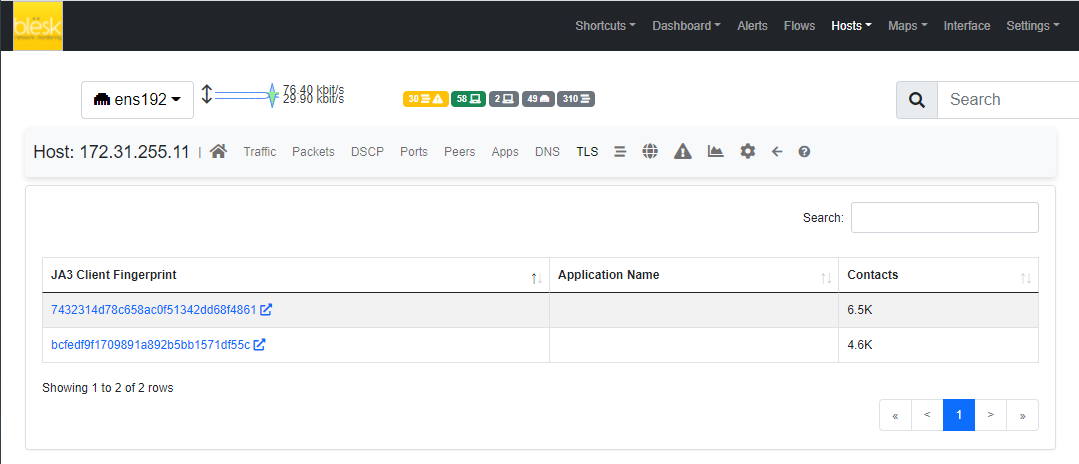
- Client and server JA3 signatures, which represent a fingerprint of the most relevant information in the TLS handshake. By clicking on the signature it is possible to manually check if the signature corresponds to a known malware into the abuse.ch database.
- The Client TLS ALPN, which contains the list of application protocols provided by the client during the TLS handshake
- The supported TLS protocols of the client
This information is very valuable in identifying potential threats on the encrypted traffic, which include but are not limited to:
- Malicious clients/server (by matching the JA3 signature)
- Expired TLS certificates
- Unsecure TLS protocols in use
- MITM TLS attacks
blësk NTA reports such events with specialized alerts.
¶ SSH Signature
In a similar way to the JA3 TLS signature, HASSH is a fingerprint on the SSH handshake. NTA generates the HASSH fingerprint of both the client and the server hosts of the flow. NTA also extracts and visualizes the SSH application banner which usually reports the name and version of the SSH client/server application used.
This information can be used to identify outdated and vulnerable programs, which undermine the hosts security. Moreover, the HASSH fingerprint can be matched against known malware signatures to identify known threats.
¶ Info
Extra information nDPI is able to extract from the detected flow is made available in this field. This field may include URLs, traffic profiles (in the Professional Version), contents of DNS requests, and so on.