¶ Overview
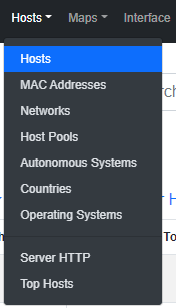
Hosts is a dropdown menu always reachable from the top toolbar that contains a range of links to host-related information pages.
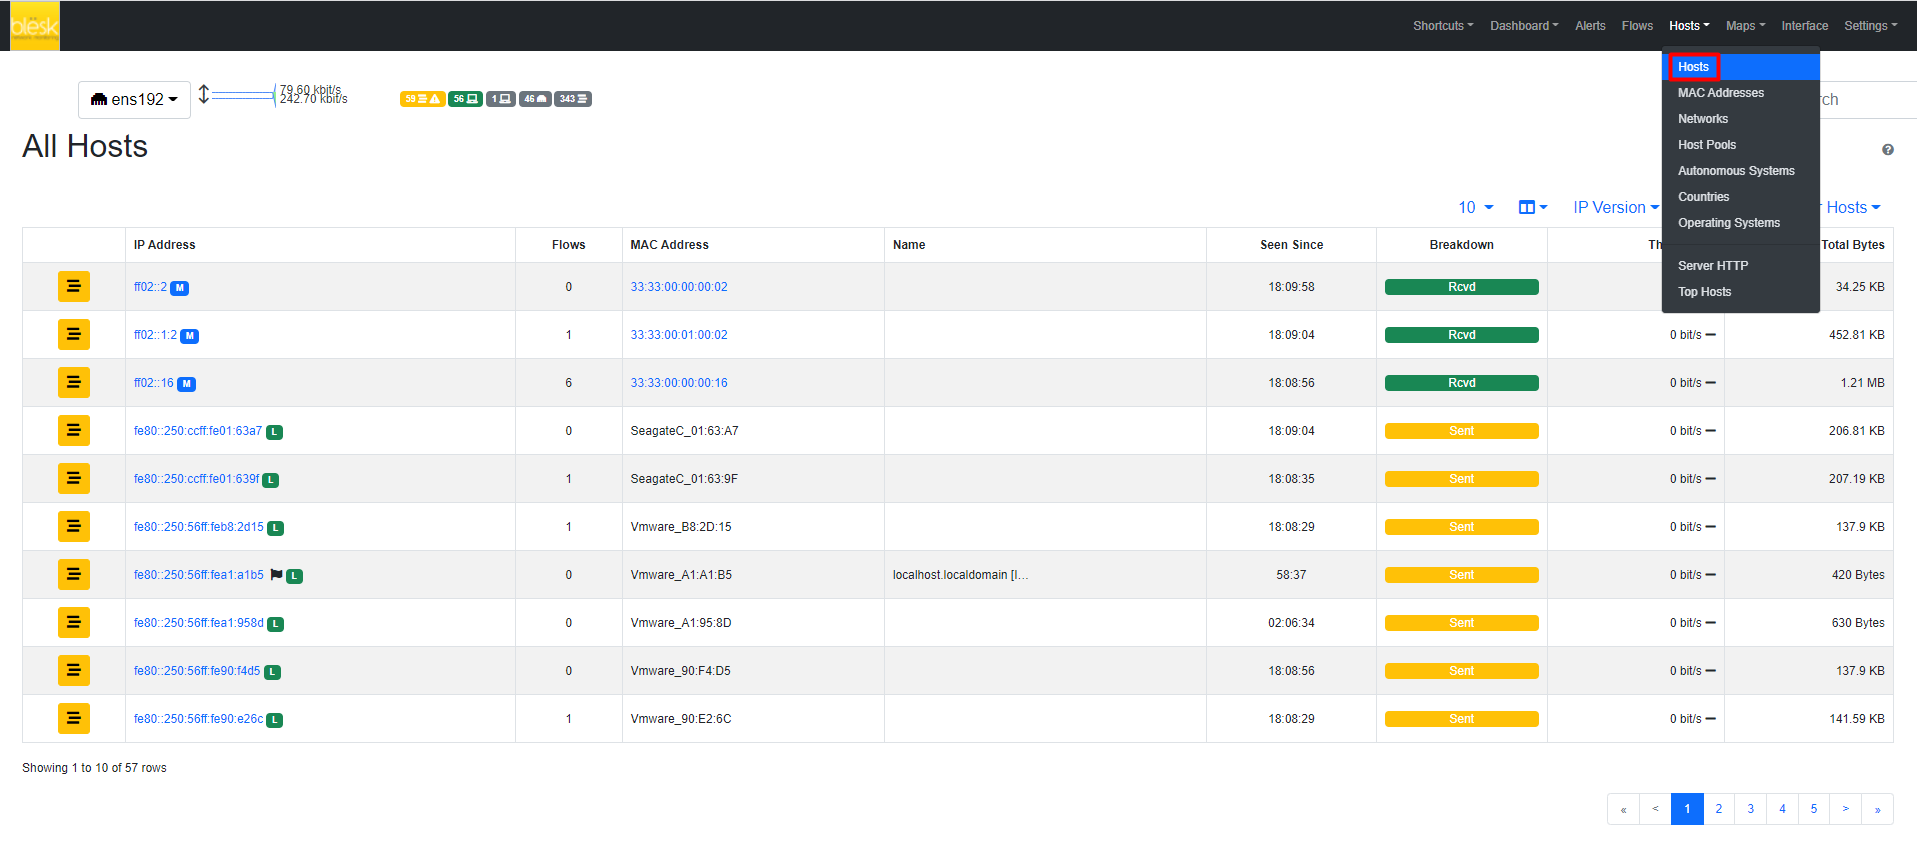
Host-related information pages available have the following content
- Hosts page shows all hosts seen
- Networks page lists all networks — both local and remote — any seen host belongs to
- Host Pools page has the list of the defined Host Pools
- Autonomous Systems page presents all Autonomous Systems (AS) any seen host belongs to
- Countries page shows hosts countries based on the information provided by MaxMind databases
- Operating Systems page lists all host operating systems that have been detected. Detection is done using passive fingerprinting techniques
- Server HTTP (Local) page shows monitored HTTP servers, limited to local hosts only
- Top Hosts Traffic page presents traffic of top hosts in order to typology selected;
¶ All Hosts
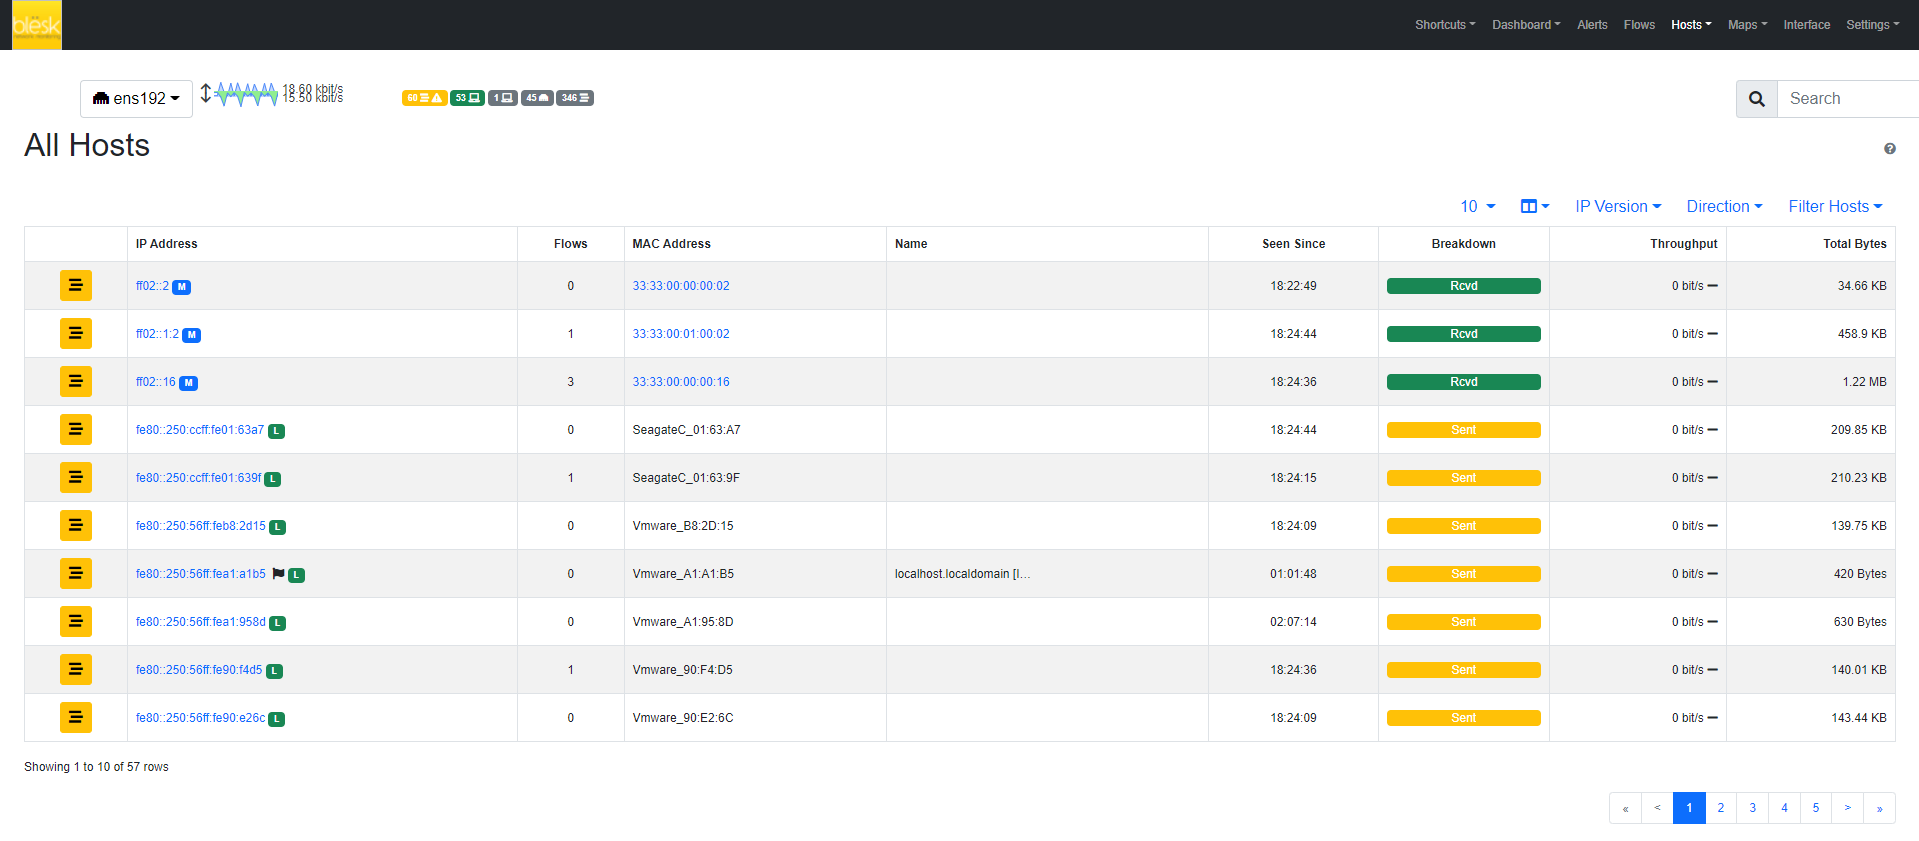
All hosts that have been seen monitoring network interfaces are shown here. Column headers can be clicked to sort results in descending (ascending) order of the clicked header. Additional sort options are available in the top right corner of the table. The table shown has several columns, including
- IP address, with optional country flag and OS logo (if detected)
- Location, either Local (the host belongs to a local network) or Remote (the host belongs to a remote network) — please note that this is not a geographical location
- Alerts, with the number of alerts associated with the host
- Name, having the resolved hostname (or a custom name, if set in any Host Details page)
- Seen Since, with the amount of time it has lapsed since the first packet sent/received by the host has been observed
- ASN, with the AS number (if available)
- Breakdown, showing a bar that gives visual insights in the use of both traffic directions
- Throughput, with the overall actual throughput of the host
- Traffic, with the total traffic exchanged by the host
Any host can be clicked to be redirected to its ‘Host Details’ page, which is discussed below.
¶ Host Pools
Host Pools are logical groups of hosts that are described in detail in the “Network Interfaces” section of this document. This page shows the list of defined and currently active Host Pools.

Each row of the table shows, for each pool, the following information:
- The Pool Name as defined by the user during Host Pool creation
- A Chart icon to access historical pool traffic time series. Historical pool traffic charts must be enabled from the preferences page and are a feature that is only supported in the Professional version.
- The number of active hosts in the pool
- The number of alerts detected as the sum of host alerts for each host in the pool
- Seen Since, with the amount of time it has lapsed since the first packet sent/received by any of the hosts in the pool has been observed
- Breakdown, showing a bar that gives visual insights in the use of both pool traffic directions
- Throughput, with the overall actual throughput of the pool
- Traffic, with the total traffic exchanged by the pool
Host pools can be configured from the network interface page.
¶ Networks
Networks show all networks discovered by blësk NTA.
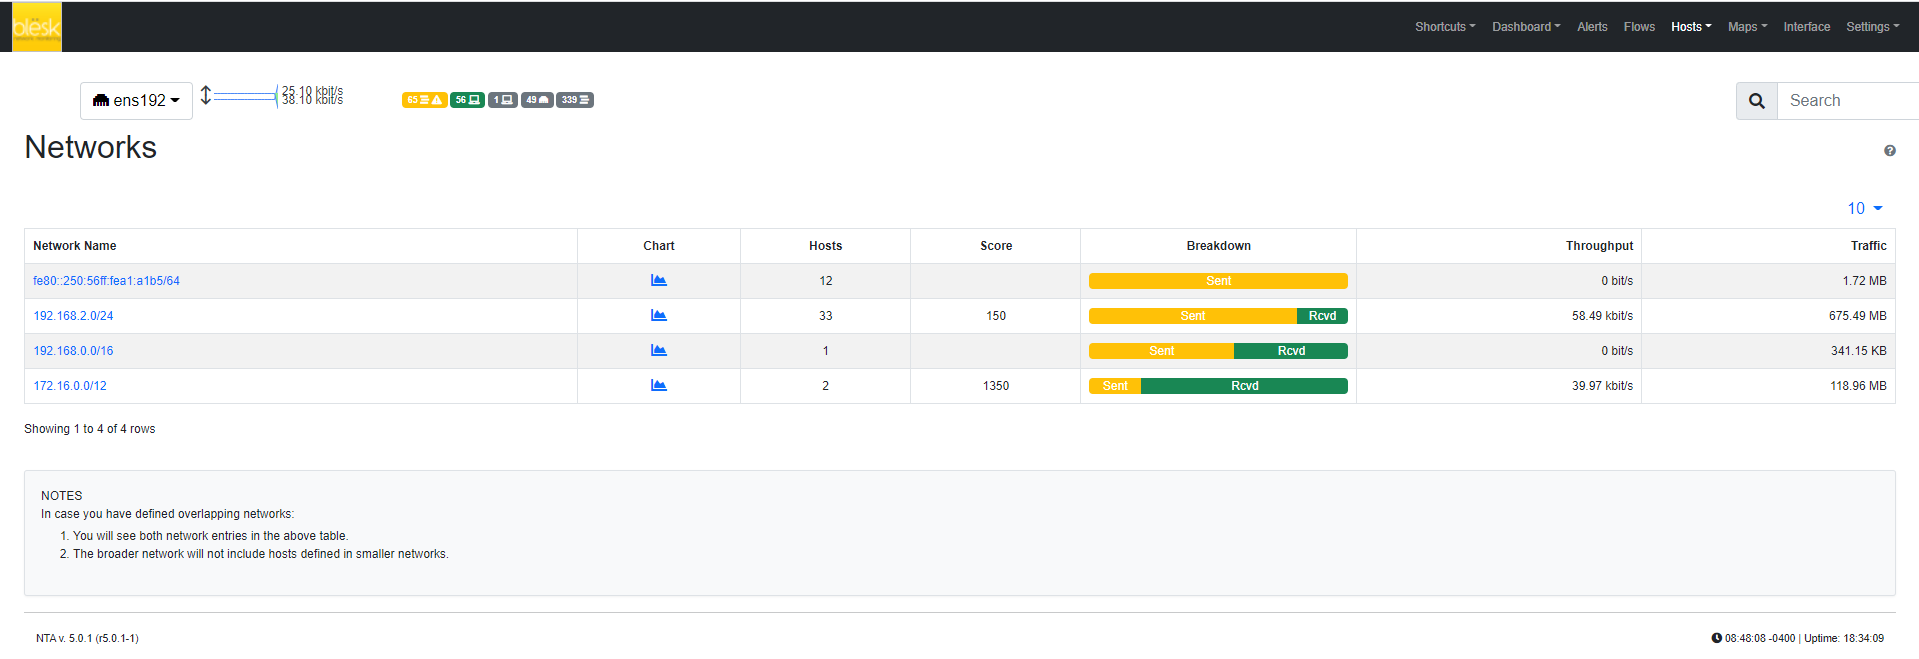
For each network discovered blësk NTA provides the number of hosts, alerts triggered, date of discovery, breakdown, throughput and traffic. Network names can be clicked to display the hosts lists inside the network selected.
¶ Autonomous Systems
Autonomous Systems shows all autonomous systems discovered by blësk NTA. Autonomous Systems require Geolocation enabled.

blësk NTA uses a Maxmind database to gather information about Autonomous Systems (AS) and based on this it groups hosts belonging to the same AS. AS number 0 contains all hosts having private IP addresses.
¶ Countries
Countries page provides all countries discovered by blësk NTA. Any country can be clicked to be redirected to a page containing the full list of hosts localized in that country. Countries require Geolocation enabled.

¶ Operating Systems
Operating Systems page shows a list of all OS detected by blësk NTA. OSes can be clicked to see the detailed list of hosts.

¶ Server HTTP
Server HTTP page lists all local HTTP Servers. Multiple distinct virtual hosts may refer to the same HTTP server IP, which is specified in the second column. Additional information such as bytes sent and received are available for each HTTP virtual host. By clicking on the magnifying lens icon near the HTTP virtual host, it is possible to display all active flows involving it.
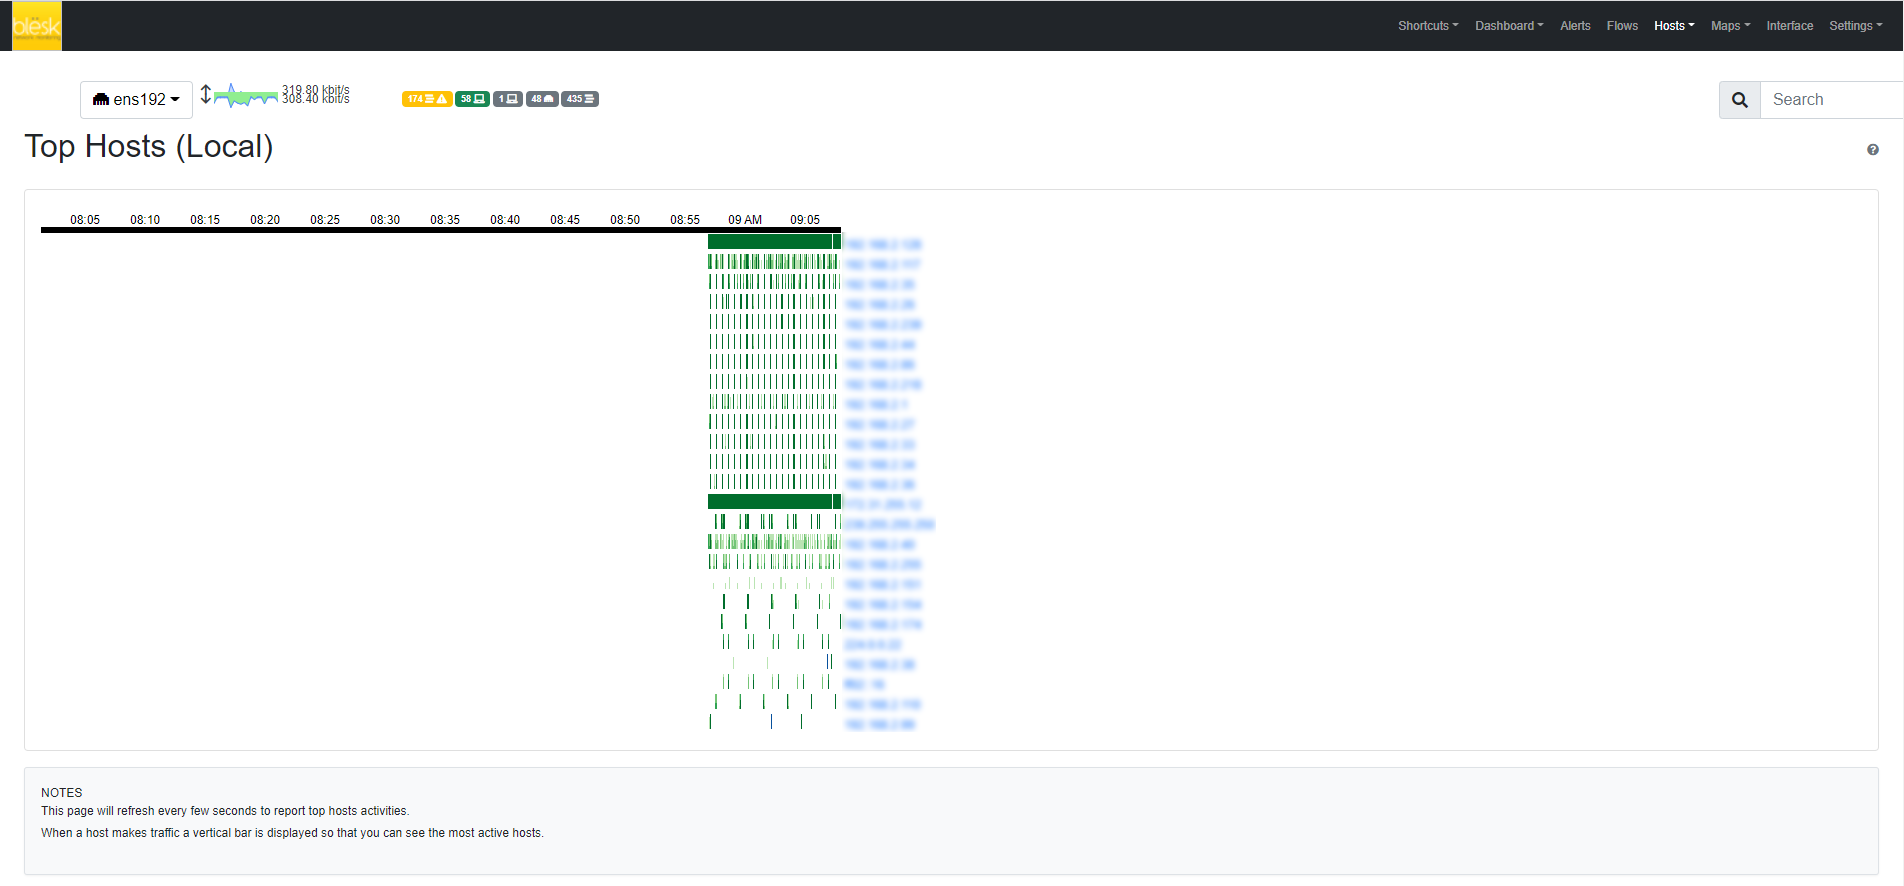
¶ Top Hosts (Local)
Top hosts page provides hosts activity on a time basis. The page should be kept open in order to allow the graph to dynamically update itself with real-time freshly collected data for each host. The time axis is divided into 5-minute bars and goes backward in time in a right-to-left fashion, starting from the present.
