¶ Summery
This section provides an overview of the traffic by the selected interface. In this section, you will see different graphs representing the traffic generated by all the hosts on your network. It consists in measuring the usage of relevant traffic activities, tracks network usage, generating a series of statistics for each host in the local subnet and for the subnet as a whole. The needed information is collected by the blësk server by analyzing data related to the network traffic.
¶ Interface
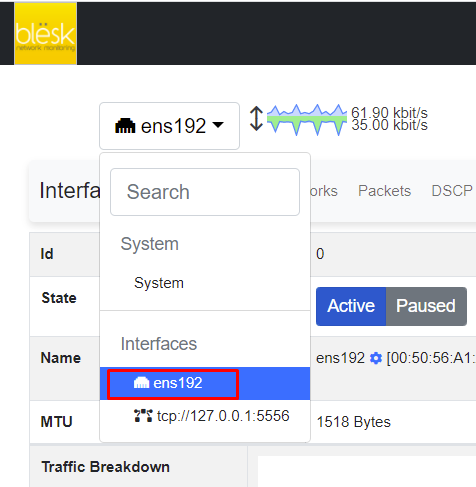
The Interface dropdown menu entry in the top toolbar contains lists of all the interfaces that are currently monitored by the NTA module of blësk. Among all interfaces listed, one is highlighted in the image below, which indicates the interface is currently selected. The selected interface is the System Interface of blësk NTA, which analyzes data collected through a physical connection. The interface represented by an IP address is a virtual interface, which analyzes data collected using bProbe from the devices connected virtually.
¶ Menus
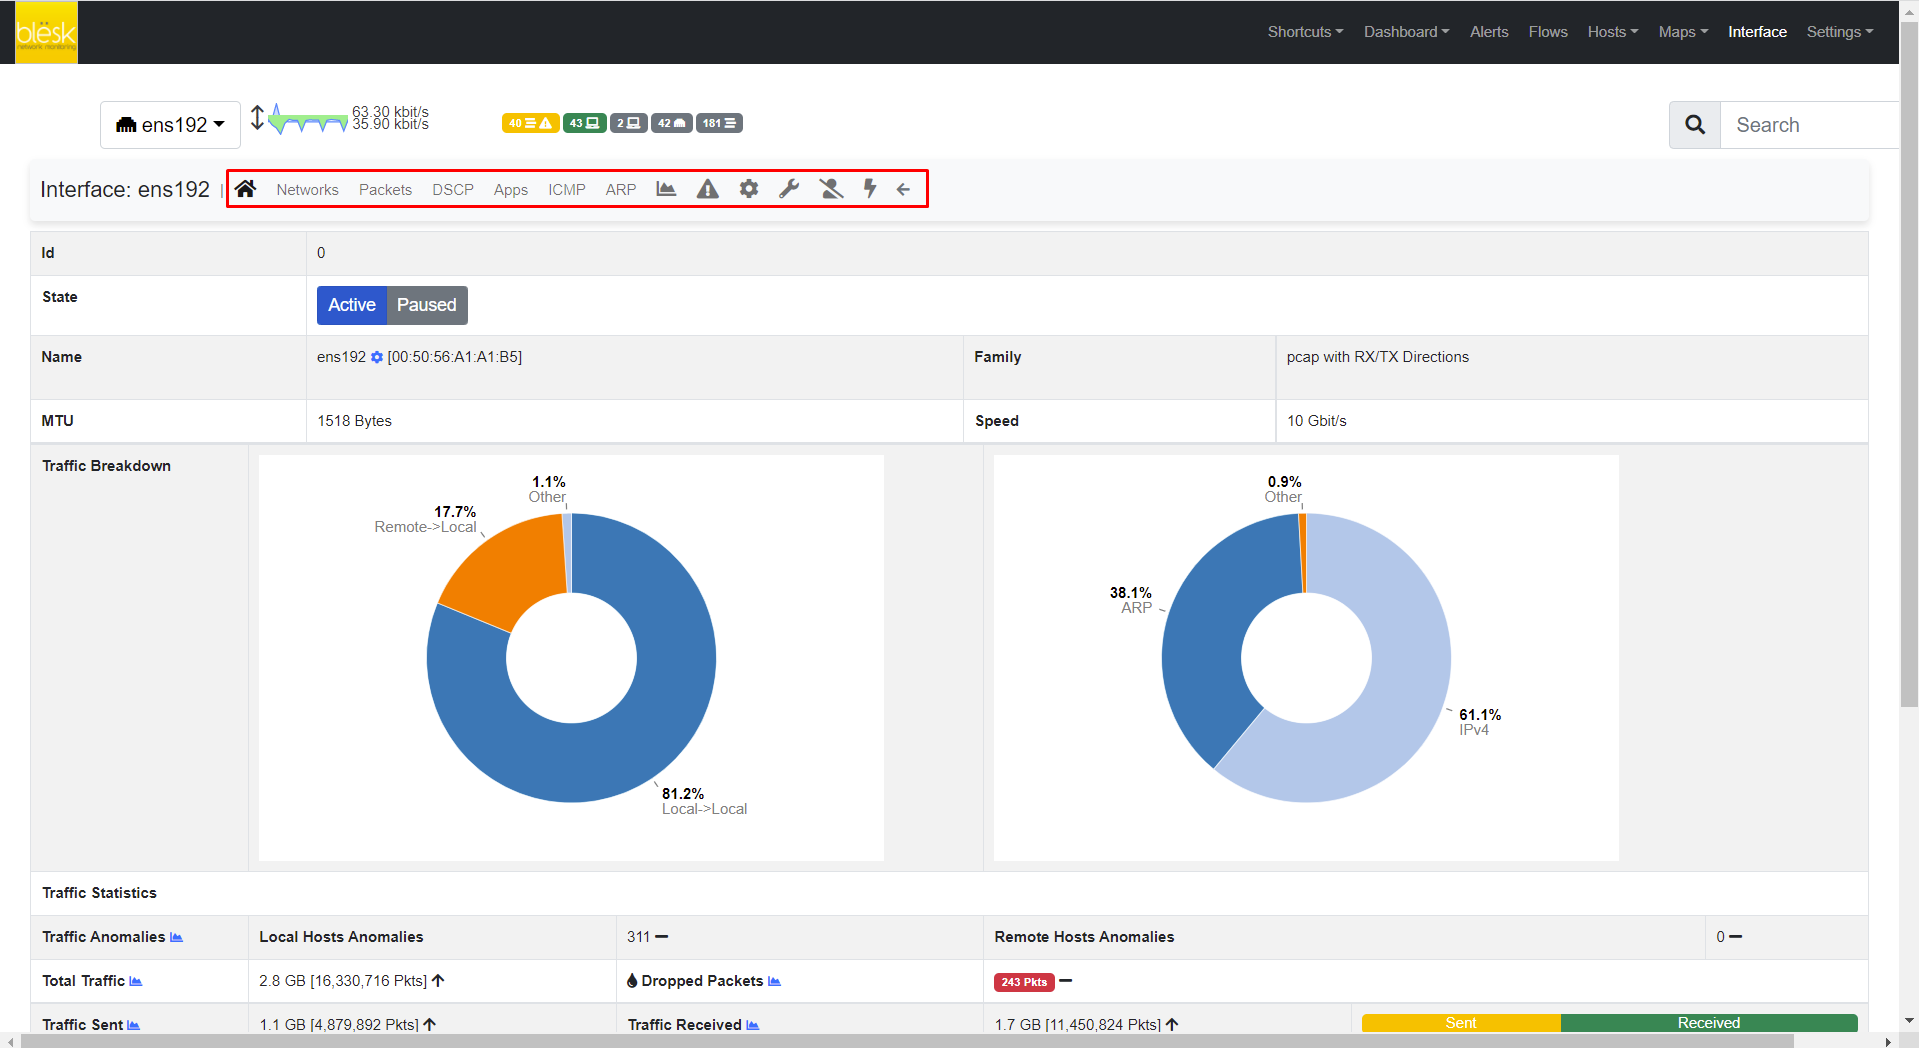
A contextual menu with multiple options and badges appears right below the top toolbar. Menu entries are discussed below.
¶ Home
On the Home page, it is possible to view general interface information, such as Id (a unique integer identifier blësk NTA assigns to each monitored interface), family (e.g., pcap), and the overall traffic counters in bytes.
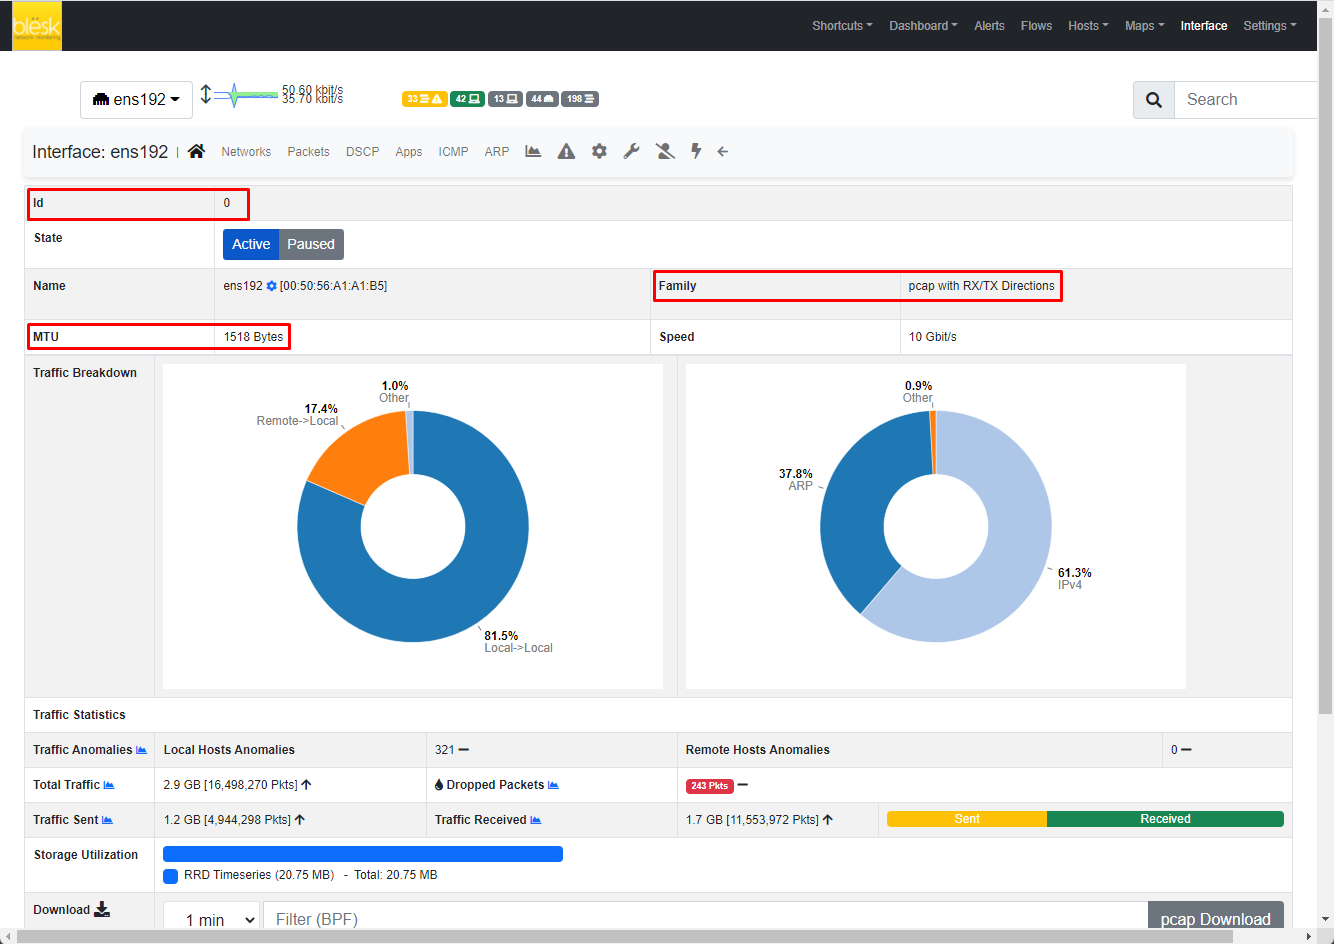
The interface name can be changed just by clicking on the cog icon next to the interface name.

Interface monitoring can be temporarily paused from the ‘State’ toggle buttons.

¶ Packets
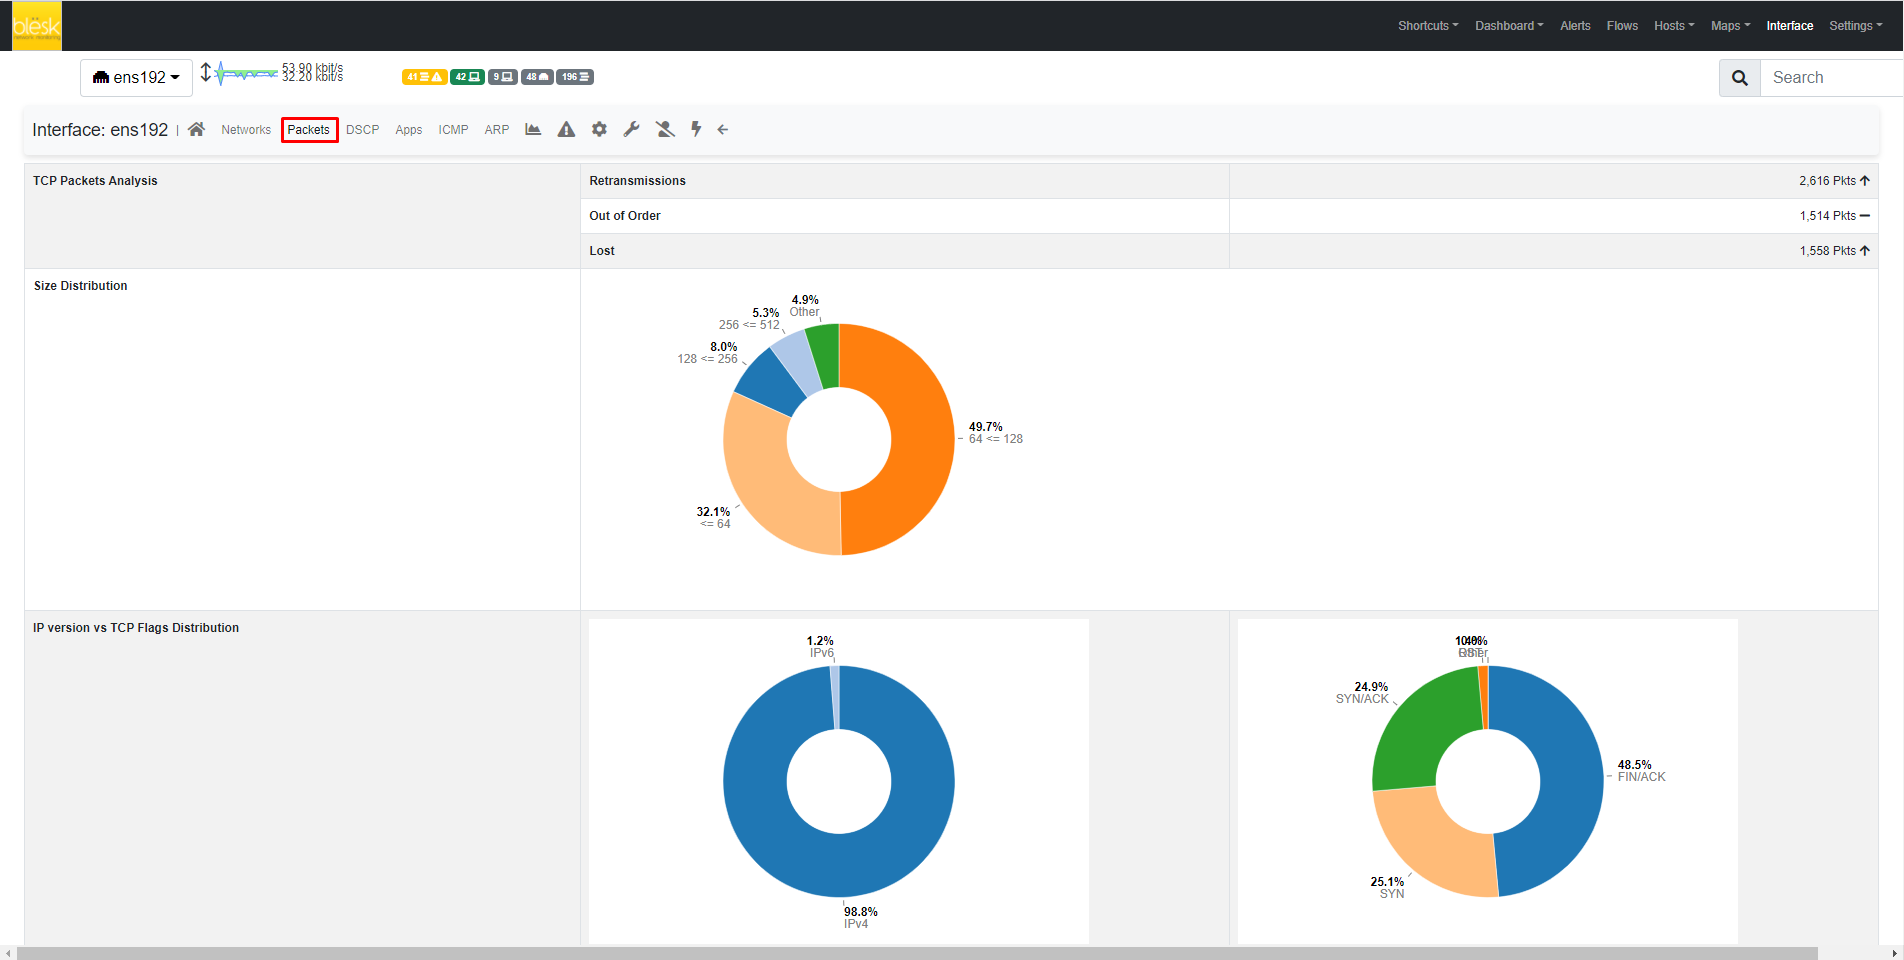
Packets page shows a pie chart of packets size distribution.
¶ Apps
Apps page provides three pie charts and a specific table with Deep Packet Inspection(DPI) detected protocols for the selected interface.
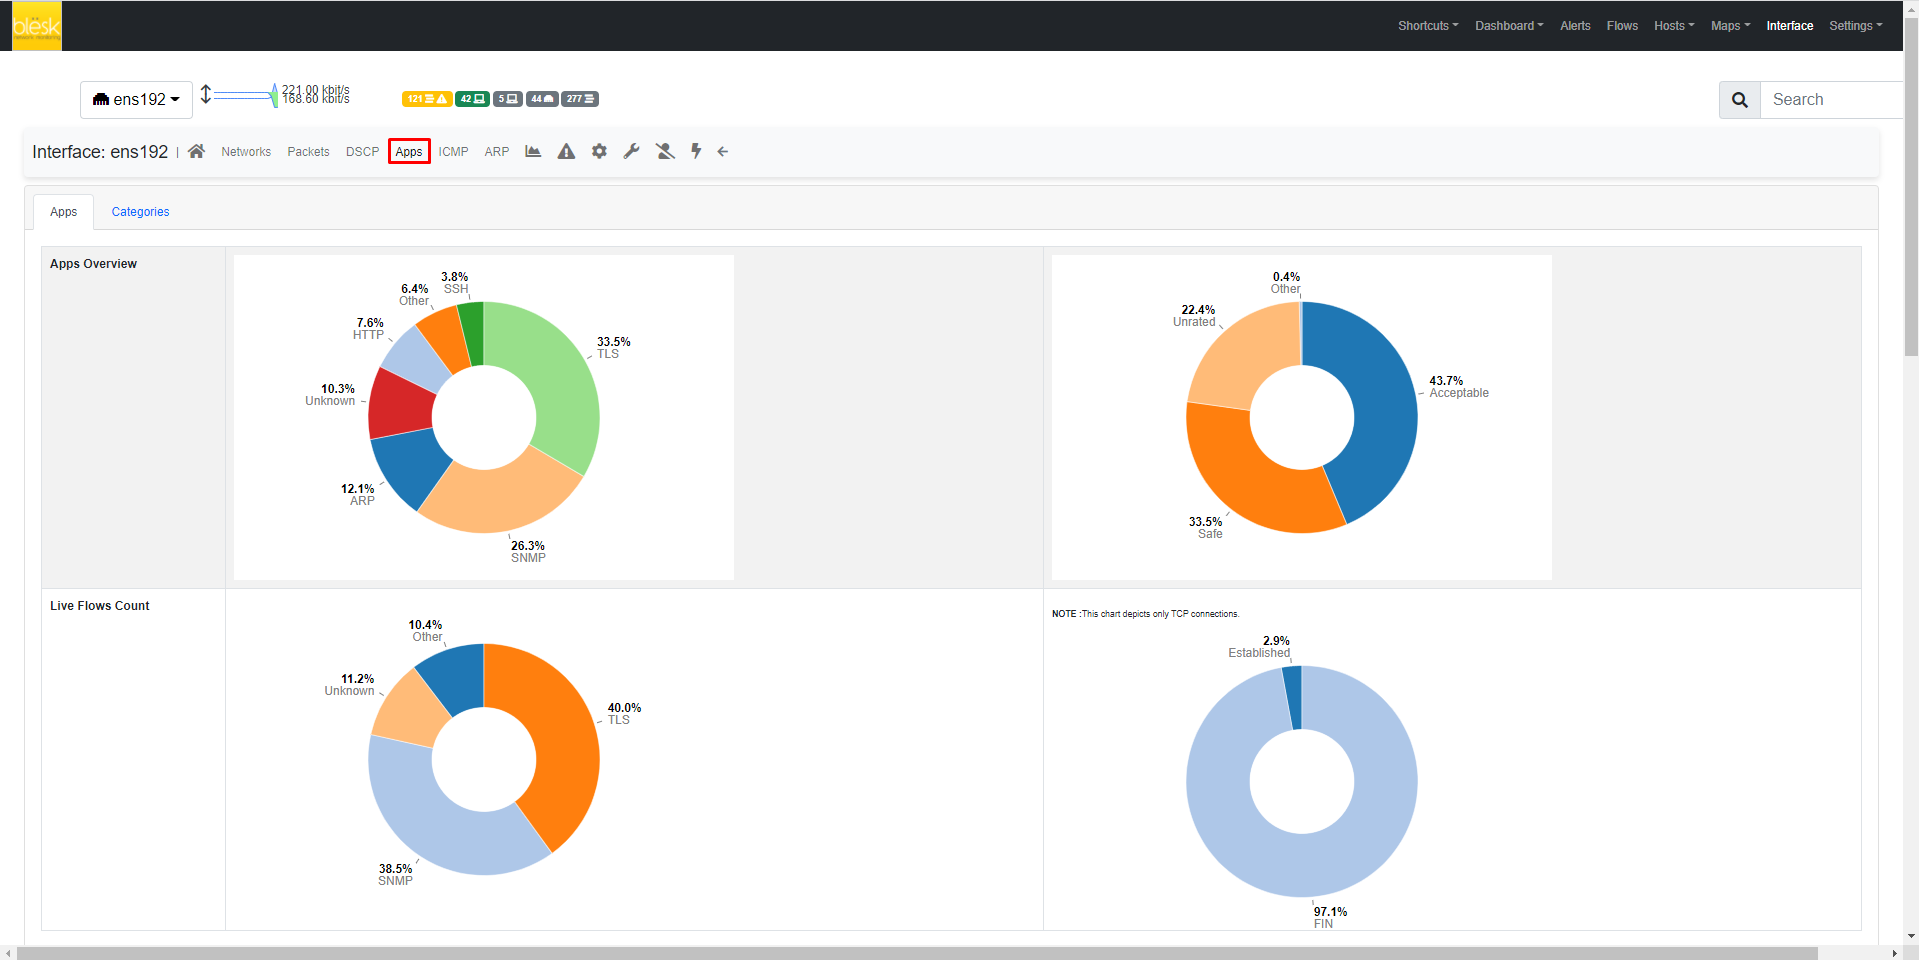
The two top pie charts show the application distribution and its categorization. The bottom pie chart shows blësk NTA DPI detected applications for currently active flows. By selecting any Application Protocol, it is possible to display a statistics page with temporal charts for that protocol. Similarly, by clicking on the magnifying lens icon, it is possible to display all active flows for that protocol.
¶ ICMP
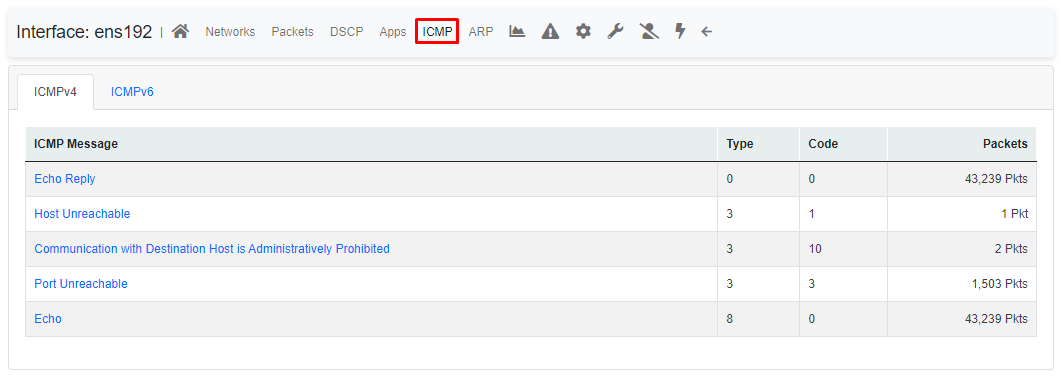
ICMP page shows overall interface ICMP statistics.
¶ ARP
The Address Resolution Protocol (ARP) page highlights the number of ARP requests and replies seen.

¶ Statistics
The Statistics page provides historical traffic statistics for the selected interface. The user can choose to filter statistics on a protocol basis and display data in several formats (e.g., bytes, packets, flows, and so on).
The time series span can be adjusted by selecting values from 5 minutes up to 1 year. In addition, time series shown can be chosen via the dropdown menu labelled ‘Timeseries’. For example, it is possible to visualize all or just one protocol, traffic, packets, active hosts and flows, and so on. blësk NTA is VLAN aware, hence if several VLANs are detected, traffic is accounted also on a VLAN basis.
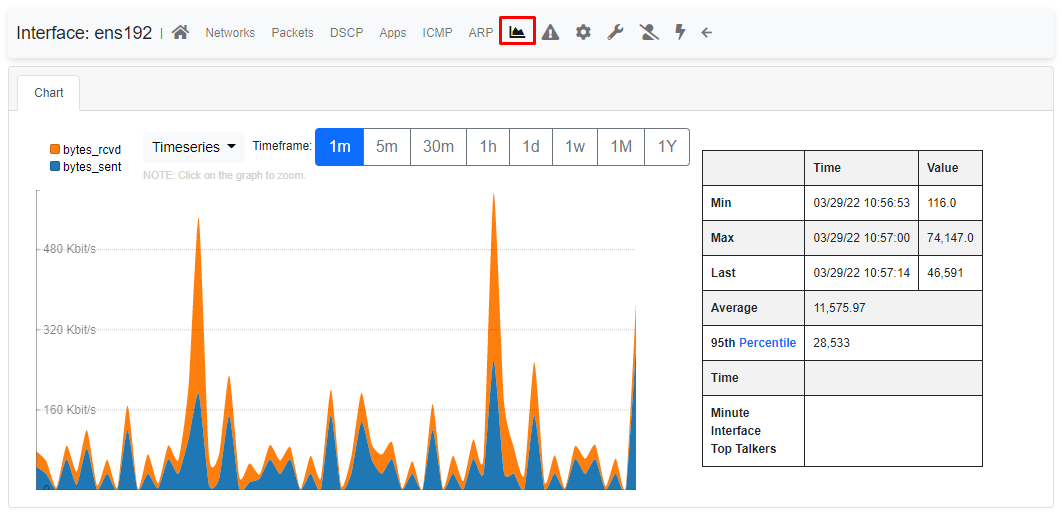
Historical interface minute top talkers are shown on the right of the page and get refreshed automatically when the mouse moves over the chart.
¶ Settings
The settings page allows the configuration of several interface properties.
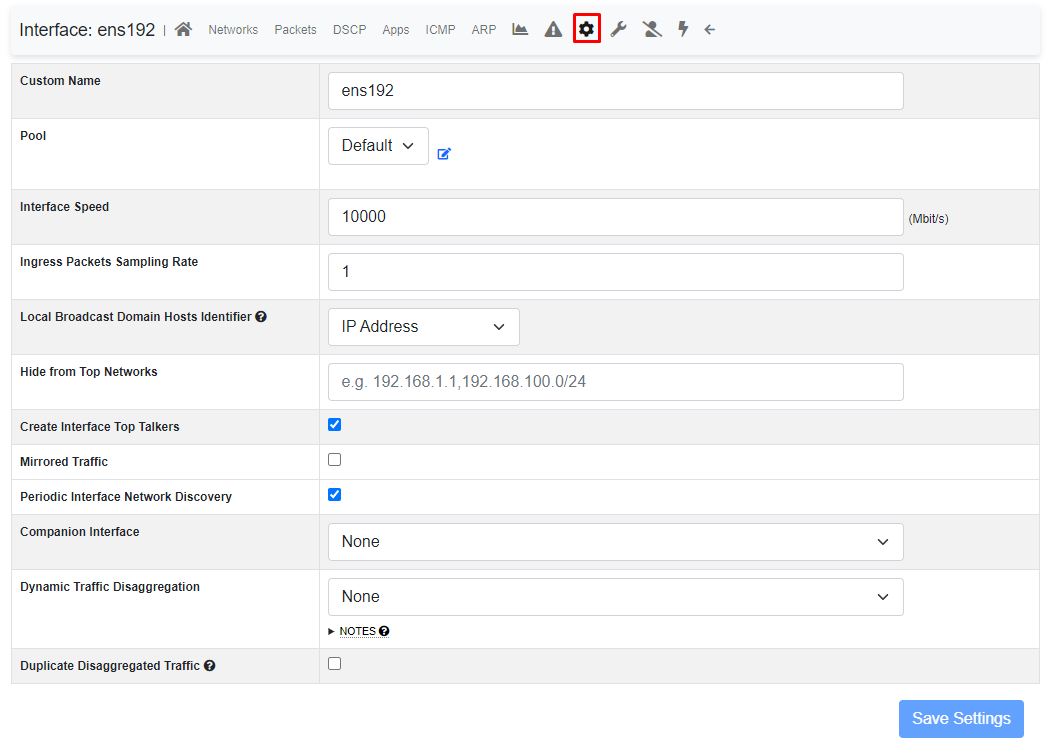
Custom Name: This is a label used to identify the interface.
Interface Speed: The speed of the interface is expressed in Mbps. Typically, blësk NTA is able to properly determine this speed automatically.
Ingress Packets Sampling Rate: Packets arriving on the interface could have been sampled upstream, for example by a packet broker or another device. This setting allows to specify the sampling rate to enable blësk NTA to perform proper upscaling.
Local Broadcast Domain Hosts Identifier: Determines if Local Broadcast Domain hosts whose IP address is inside a configured DHCP range are serialized by their MAC address or IP address. This setting also applies to the timeseries of the host. In a DHCP network, the IP address of a host usually changes so the host it’s better identified by its MAC address in this case.
Hide from Top Networks: This setting allows to specify a comma-separated list of networks containing hosts that have to be hidden from the top statistics. Hosts belonging to the specified networks will not be shown in the top statistics.
Create Interface Top Talkers: This setting toggles the creation of top talkers hosts, which are then shown into the blësk NTA report.
Mirrored Traffic: Tick this setting when the interface is receiving traffic from a mirror/SPAN port. Typically, such interfaces does not have any IP address associated. blësk NTA uses this information to skip certain kind of activities that cannot be performed on mirrored interfaces, including network device discovery and eBPF events processing.
Periodic Interface Network Discovery: This setting toggles blësk NTA periodic network discovery. Network discovery frequency can be controlled from the preferences and it defaults to 15 minutes.
Duplicate Disaggregated Traffic: When the Dynamic Traffic Disaggregation option is set, normally blësk NTA will only report the traffic on the disaggregated interfaces, hence the main interface will have no traffic. By enabling this option it’s possible to also report the traffic on the main interface.
¶ DHCP Range
When a DHCP server is active in the network monitored by a network interface, it’s advisable to configure in blësk NTA the ranges of IP addresses that such server can assign.

When a DHCP range is configured, blësk NTA will monitor the DHCP traffic on the interface and report anomalous behavior.