¶ Application Performance Monitor (APM)
To access Application Performance Monitor (APM) module for the first time, we need to follow the steps below:
1. Navigate to Application Performance Monitor (APM) page from the homepage navigation menu

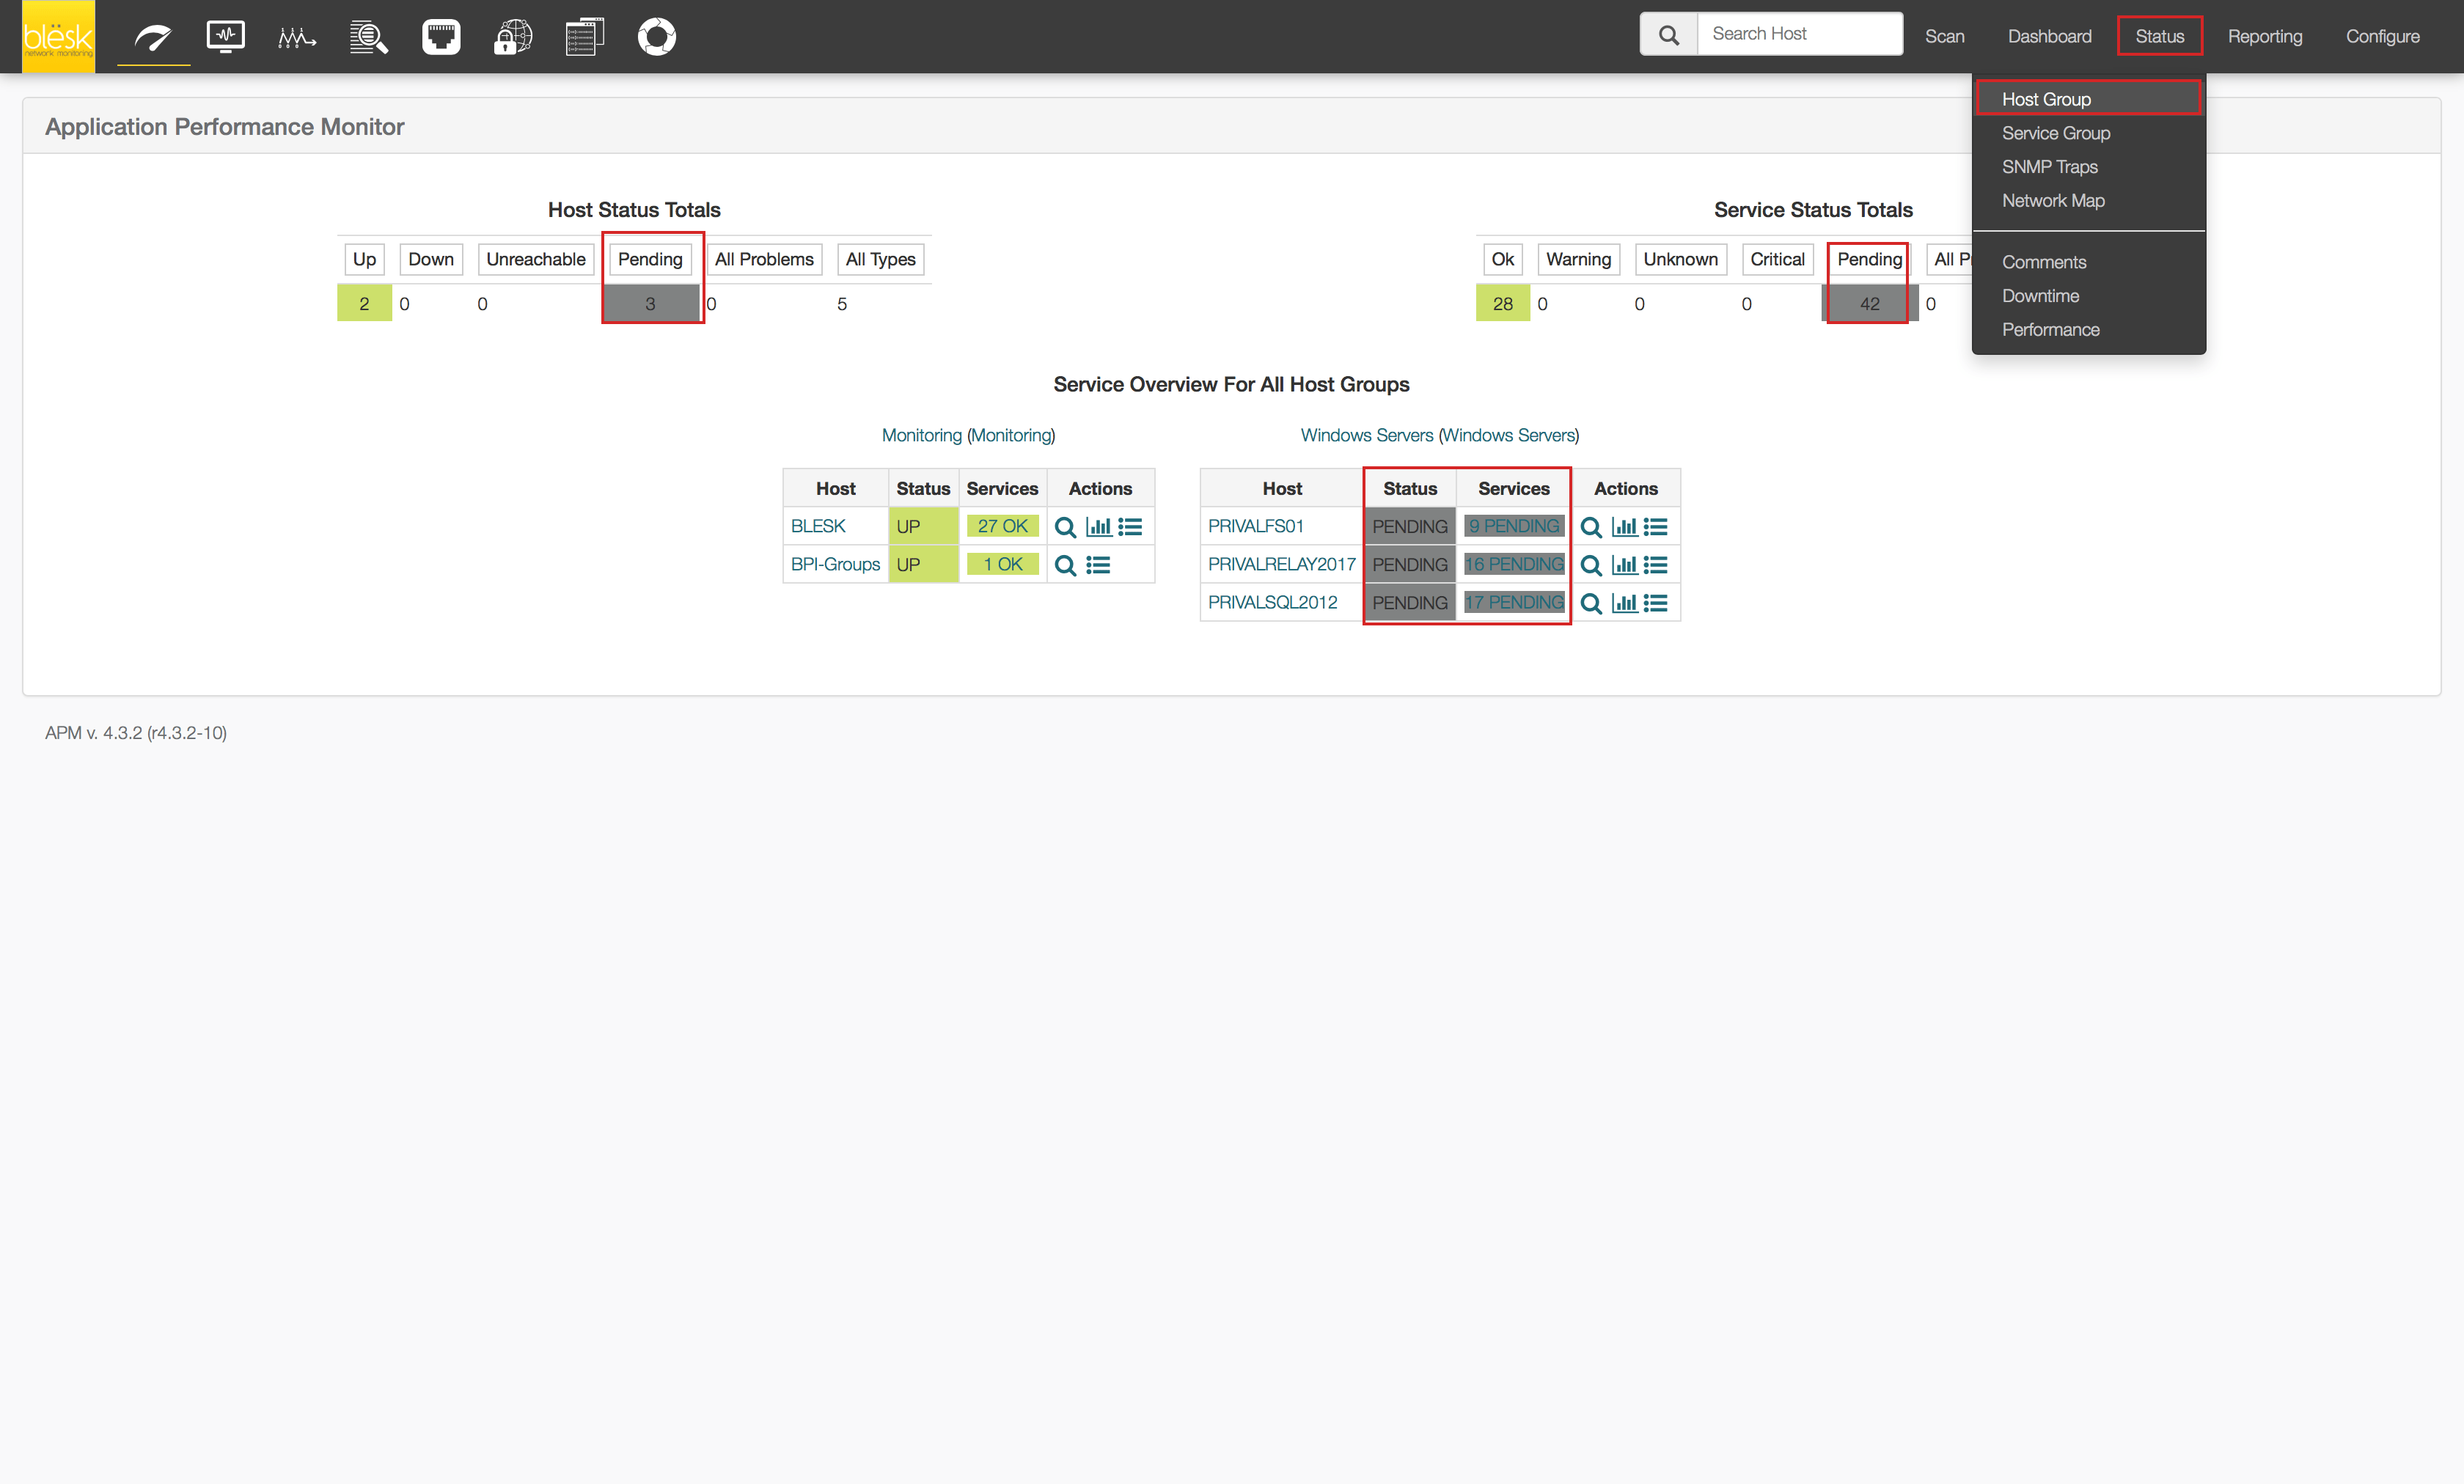
2. Click on <<Scan>> from the menu bar
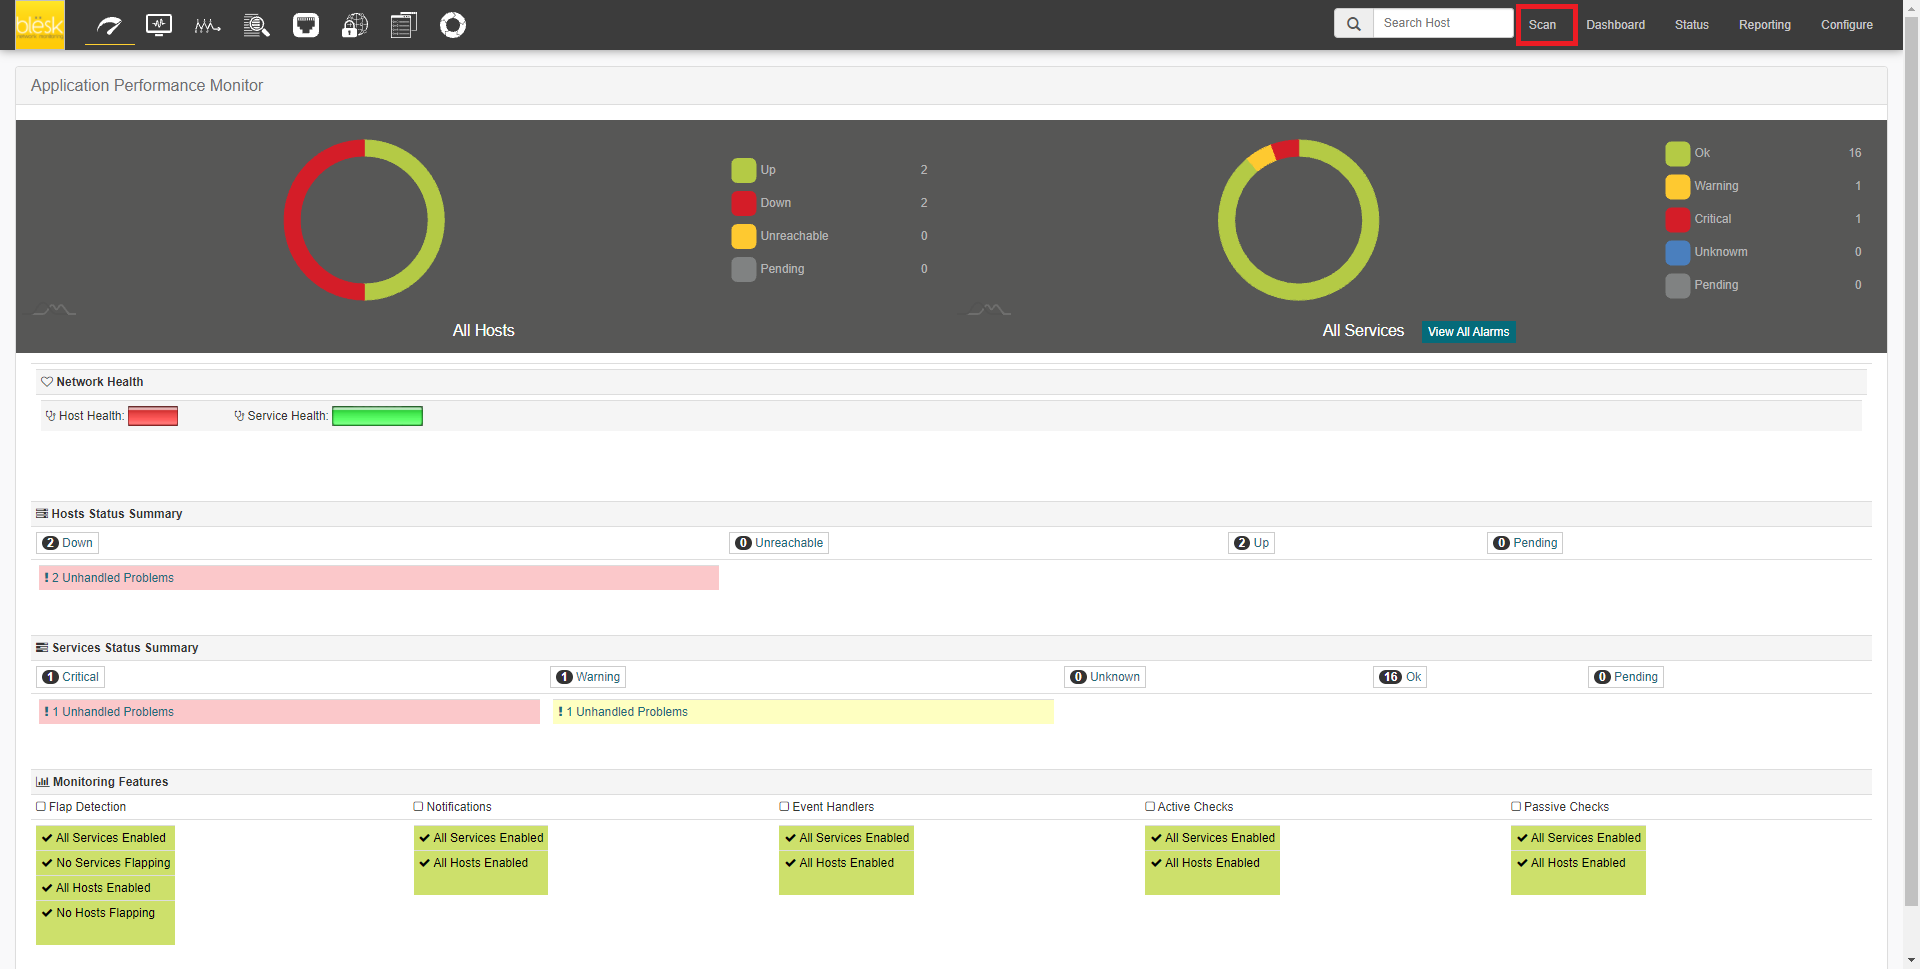
3. Click on Credentials from the top menu. Ensure that all required credentials (WMI, VMware, SSH, Telnet, and SNMP if needed) are already defined

4. Click on Scan from the top menu bar to navigate back to Scan page. Start a new discovery scan of a portion of your network (subnet) or enter all known devices you want to scan separated by comma.

5. If the devices are not listed in your preferred group, just select them and change the group (if you prefer to use your own group name to classify your devices, just create the new group directly from the Auto Detection page).
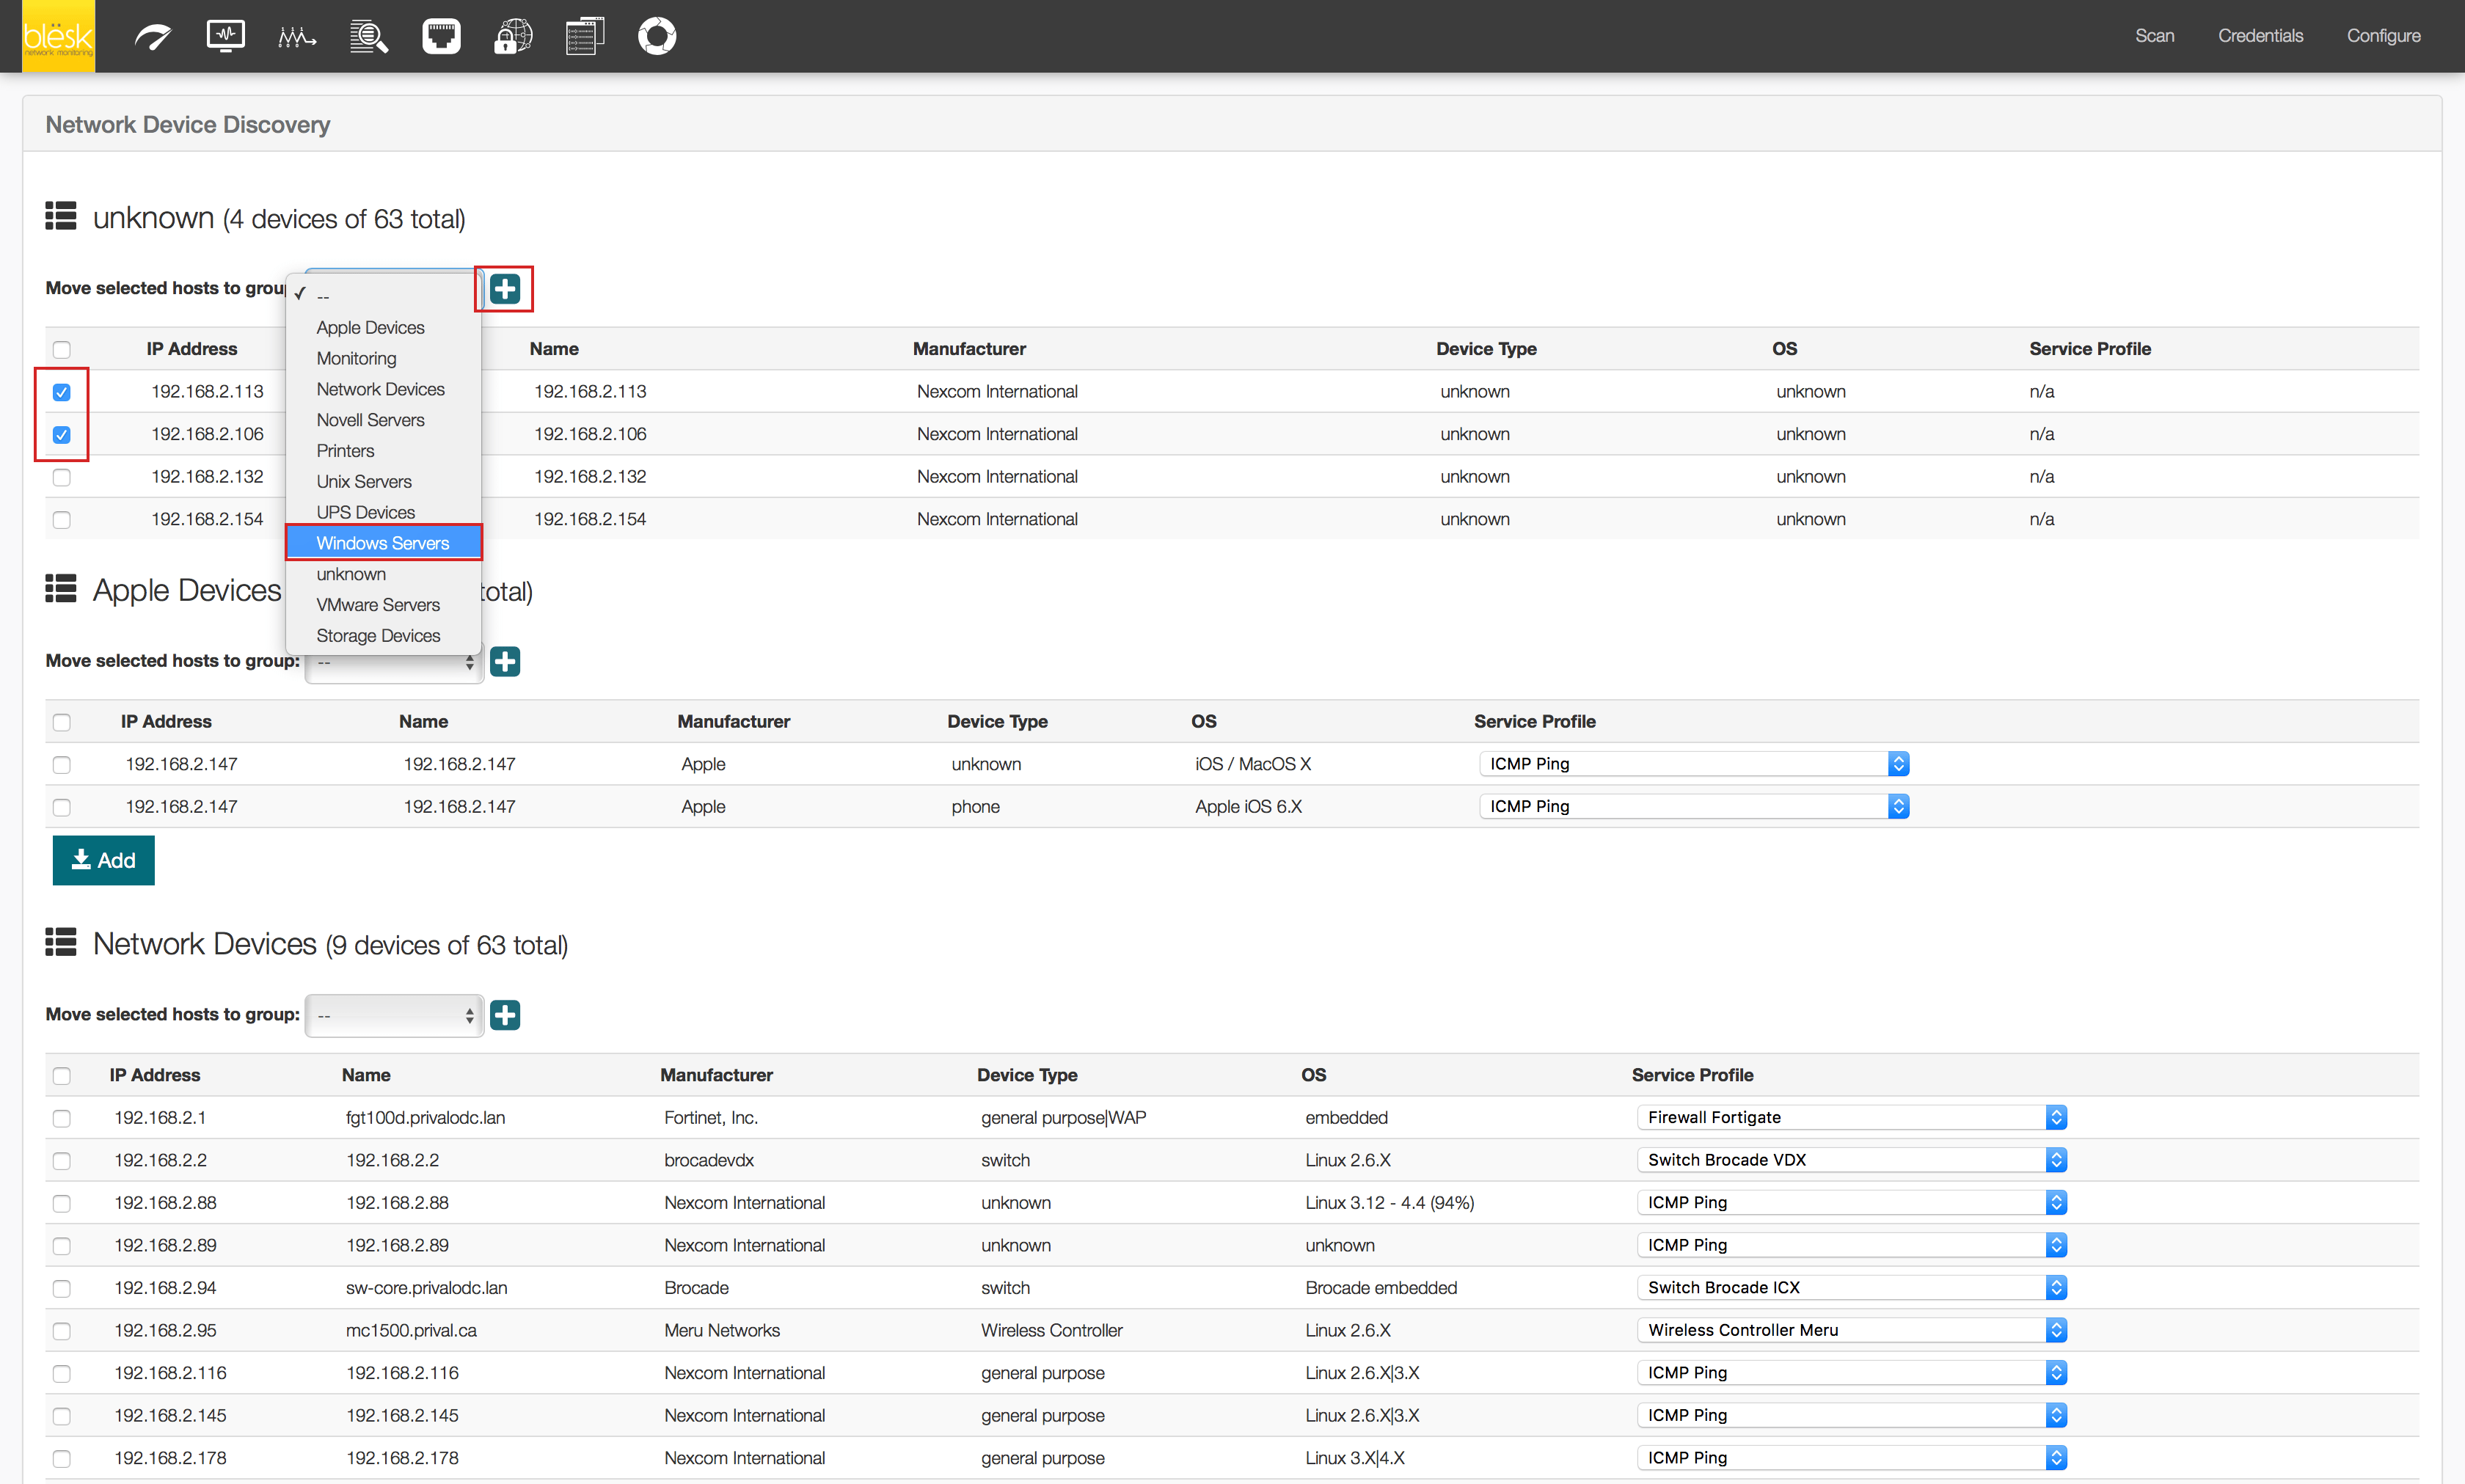
6. Select the devices you want to monitor and click the « Import » button to automatically import them into the APM module.
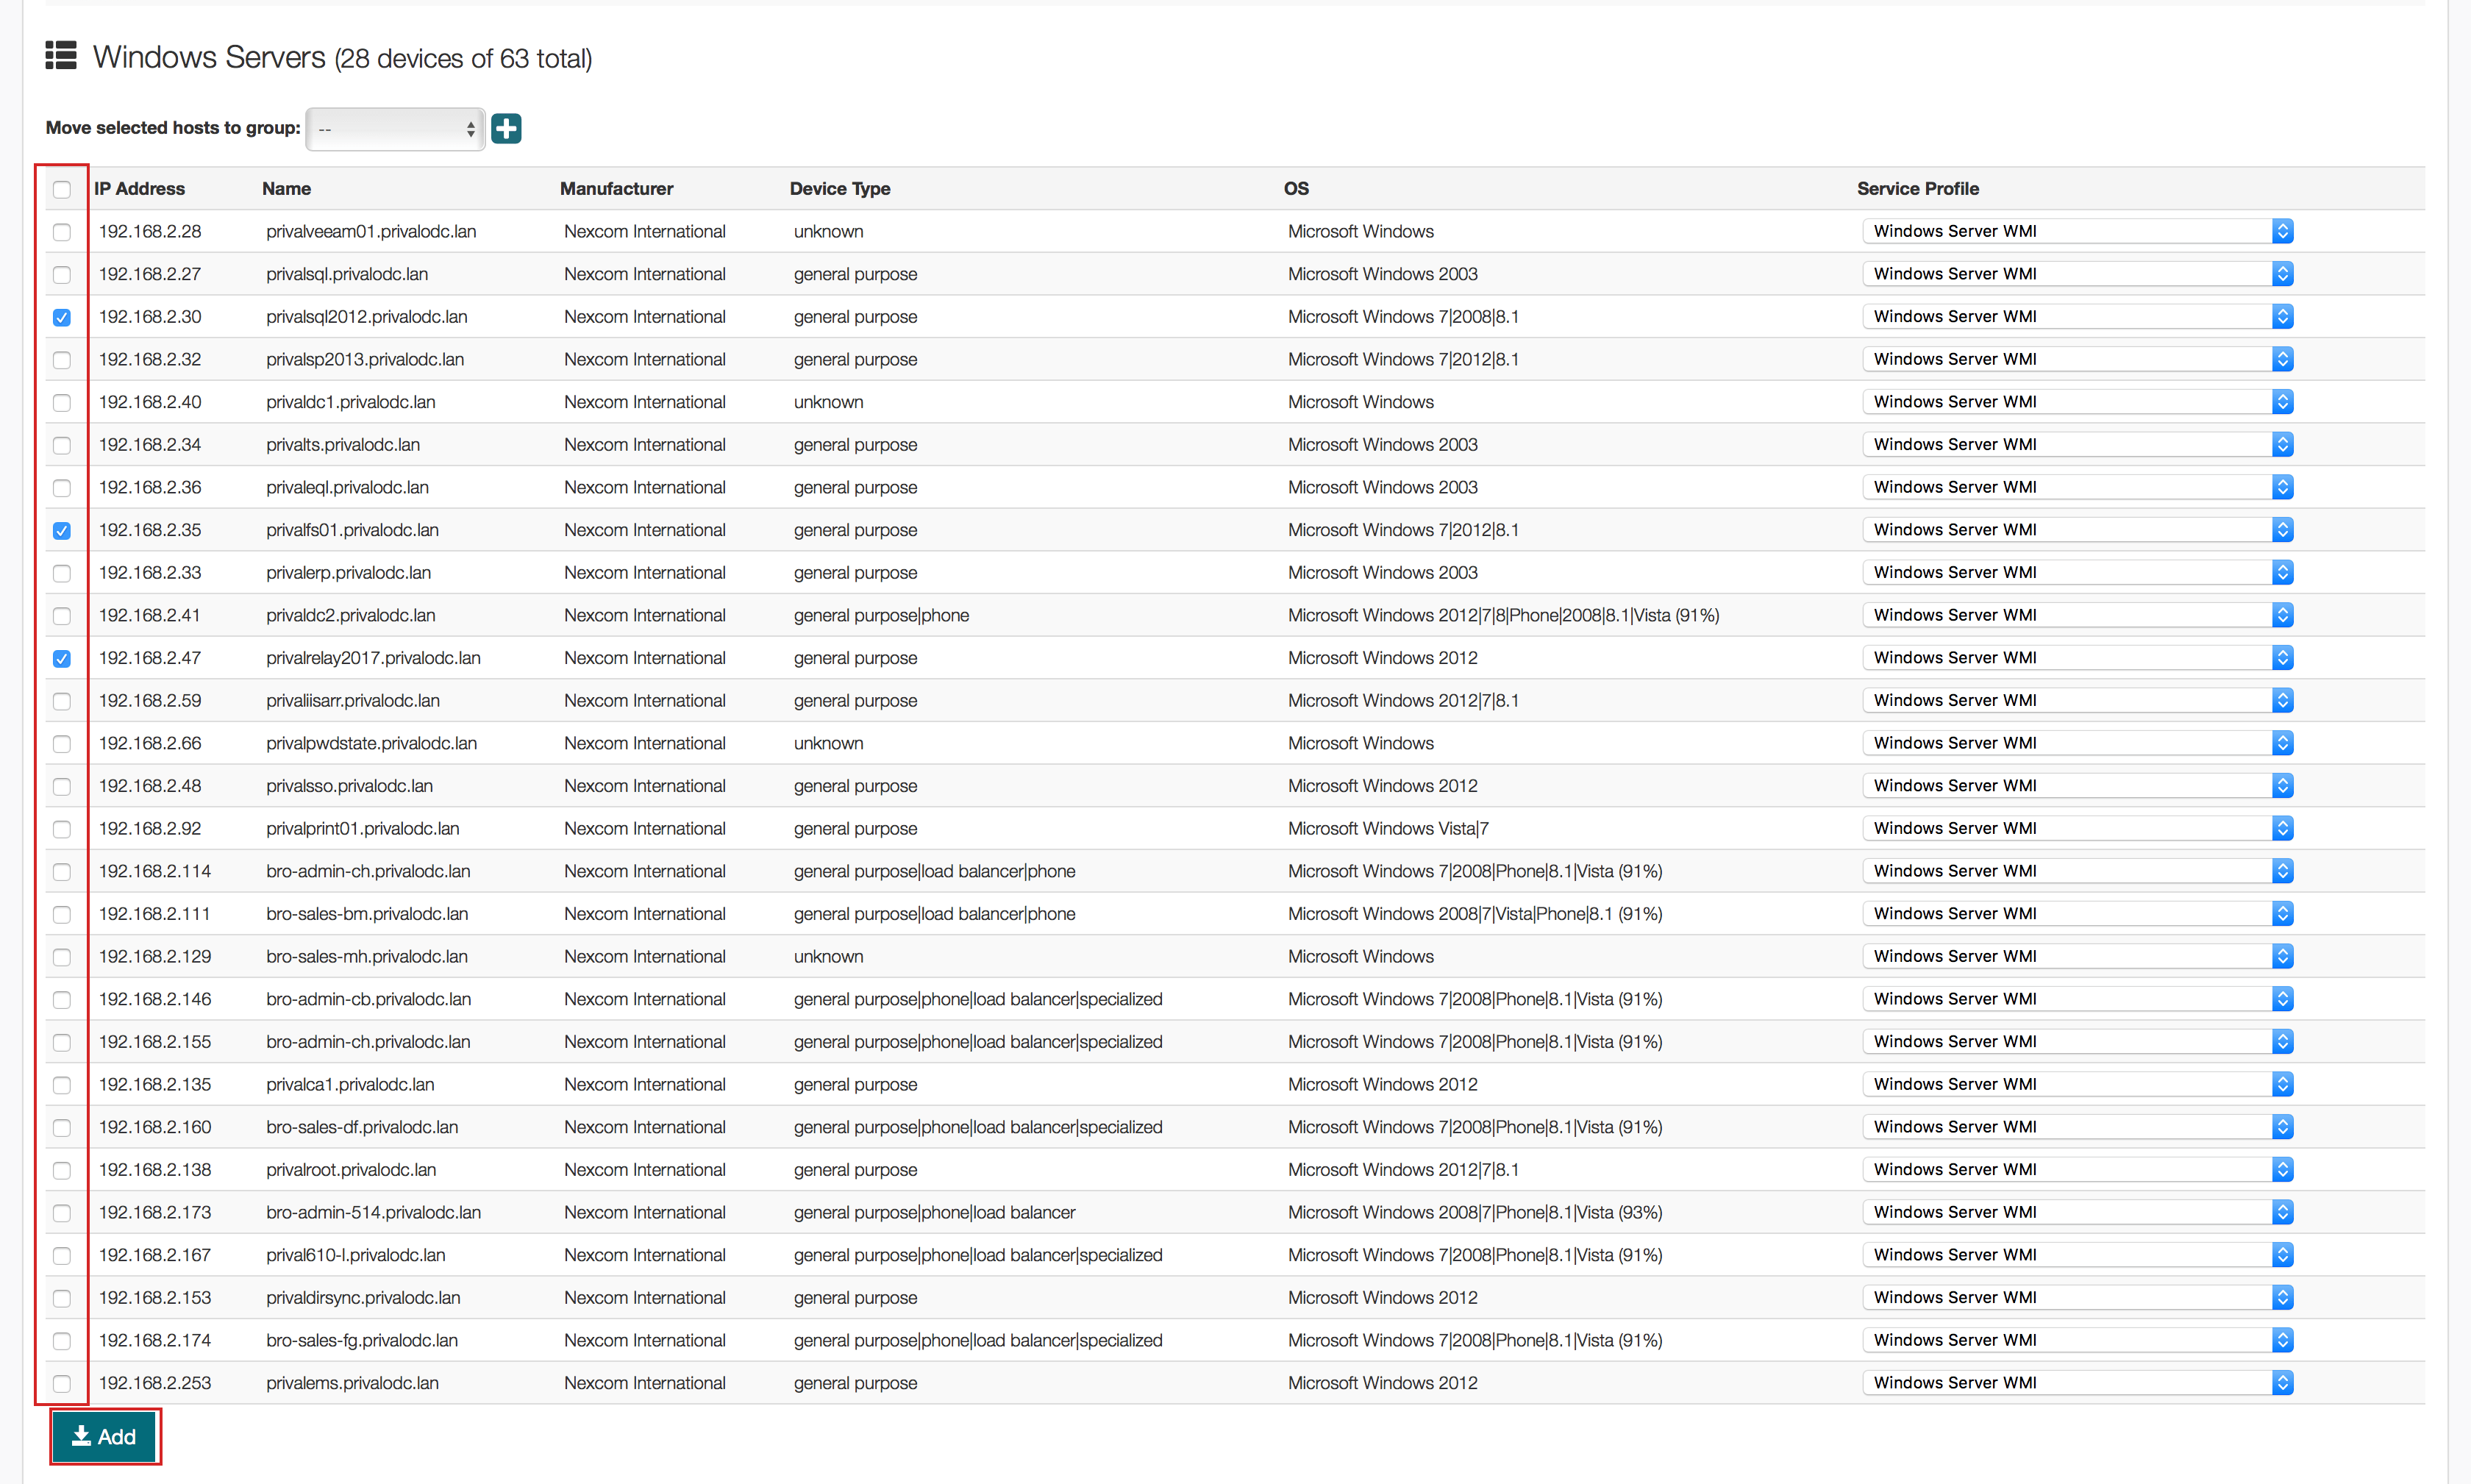
7. From this point, you can go to Application Performance Monitor (APM) and see the devices you’ve imported using the blësk auto detection module (NDD).
¶ Network Performance Monitor (NPM)
The blësk NPM module requires the SNMP protocol, which should have already been defined and configured during the installation. The auto detection part of the software will handle all the jobs related to automatic importation, so there should be nothing for you to do except defining additional subnet(s) to scan if needed.
1. To start, navigate to Network Performance Monitor (NPM) from the homepage menu.

2. On the NPM page, click on Scan from the top menu bar and then LAN from the Network Name list.
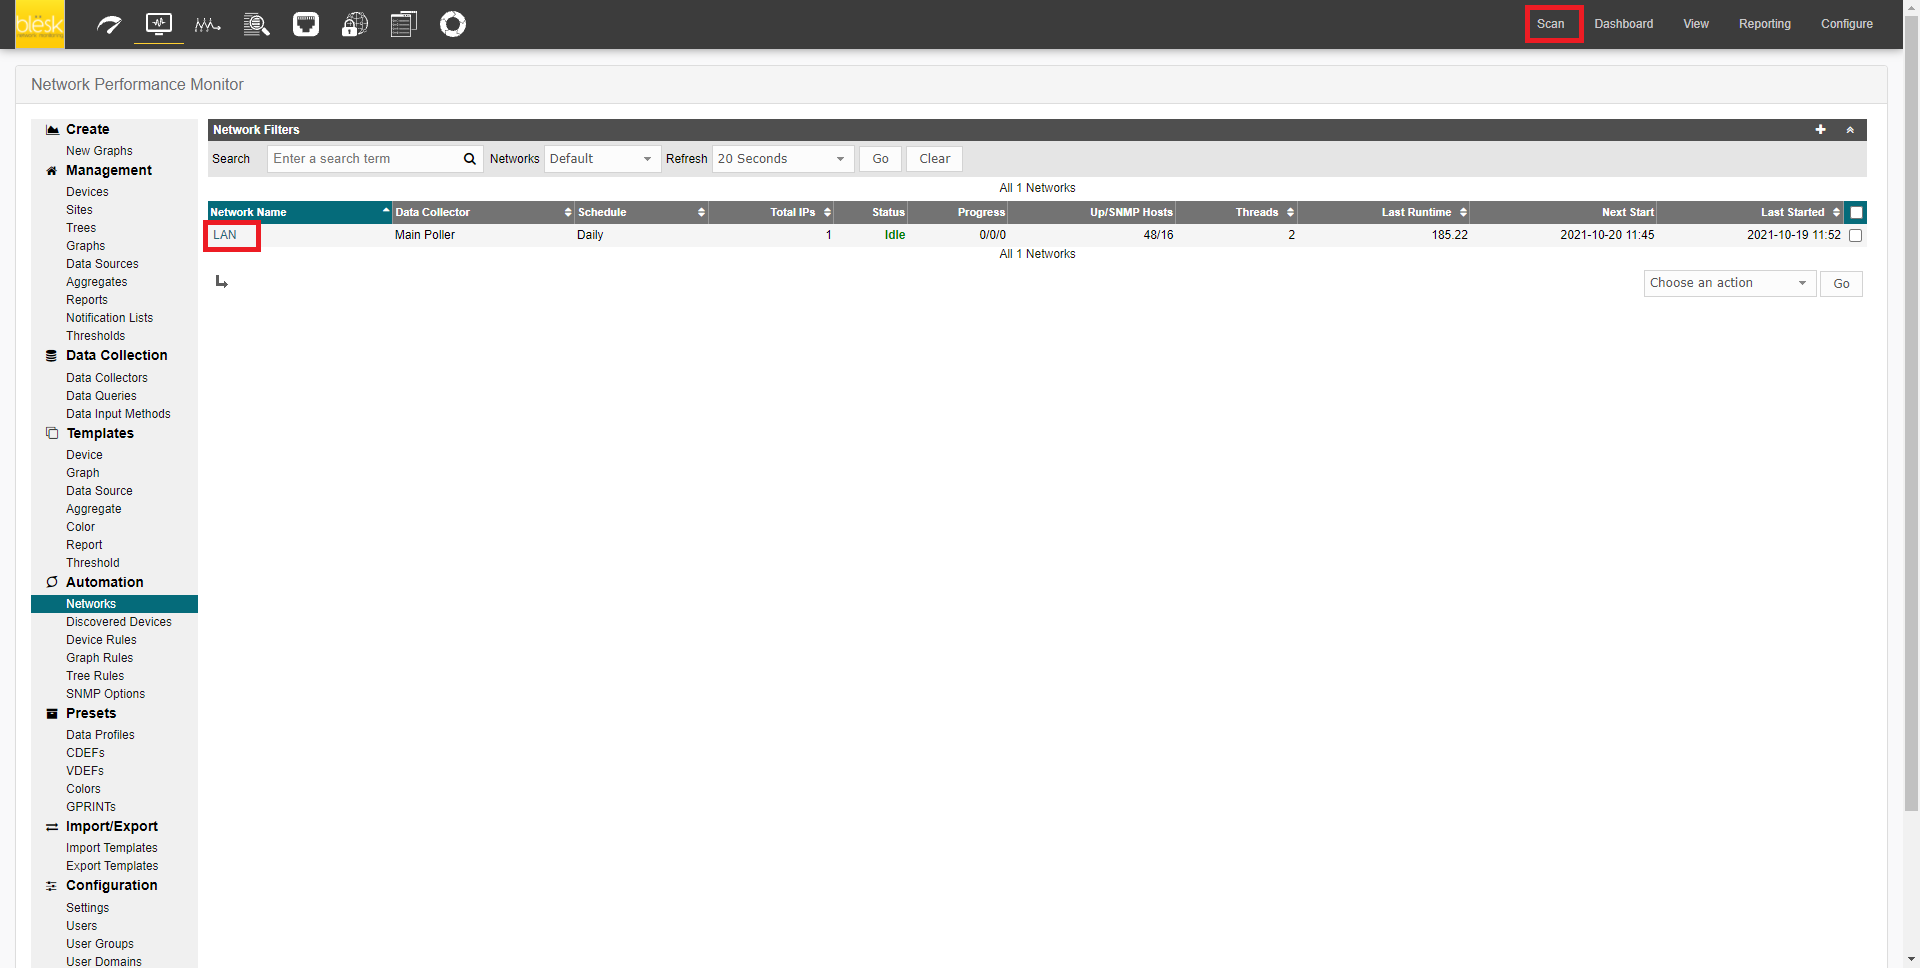
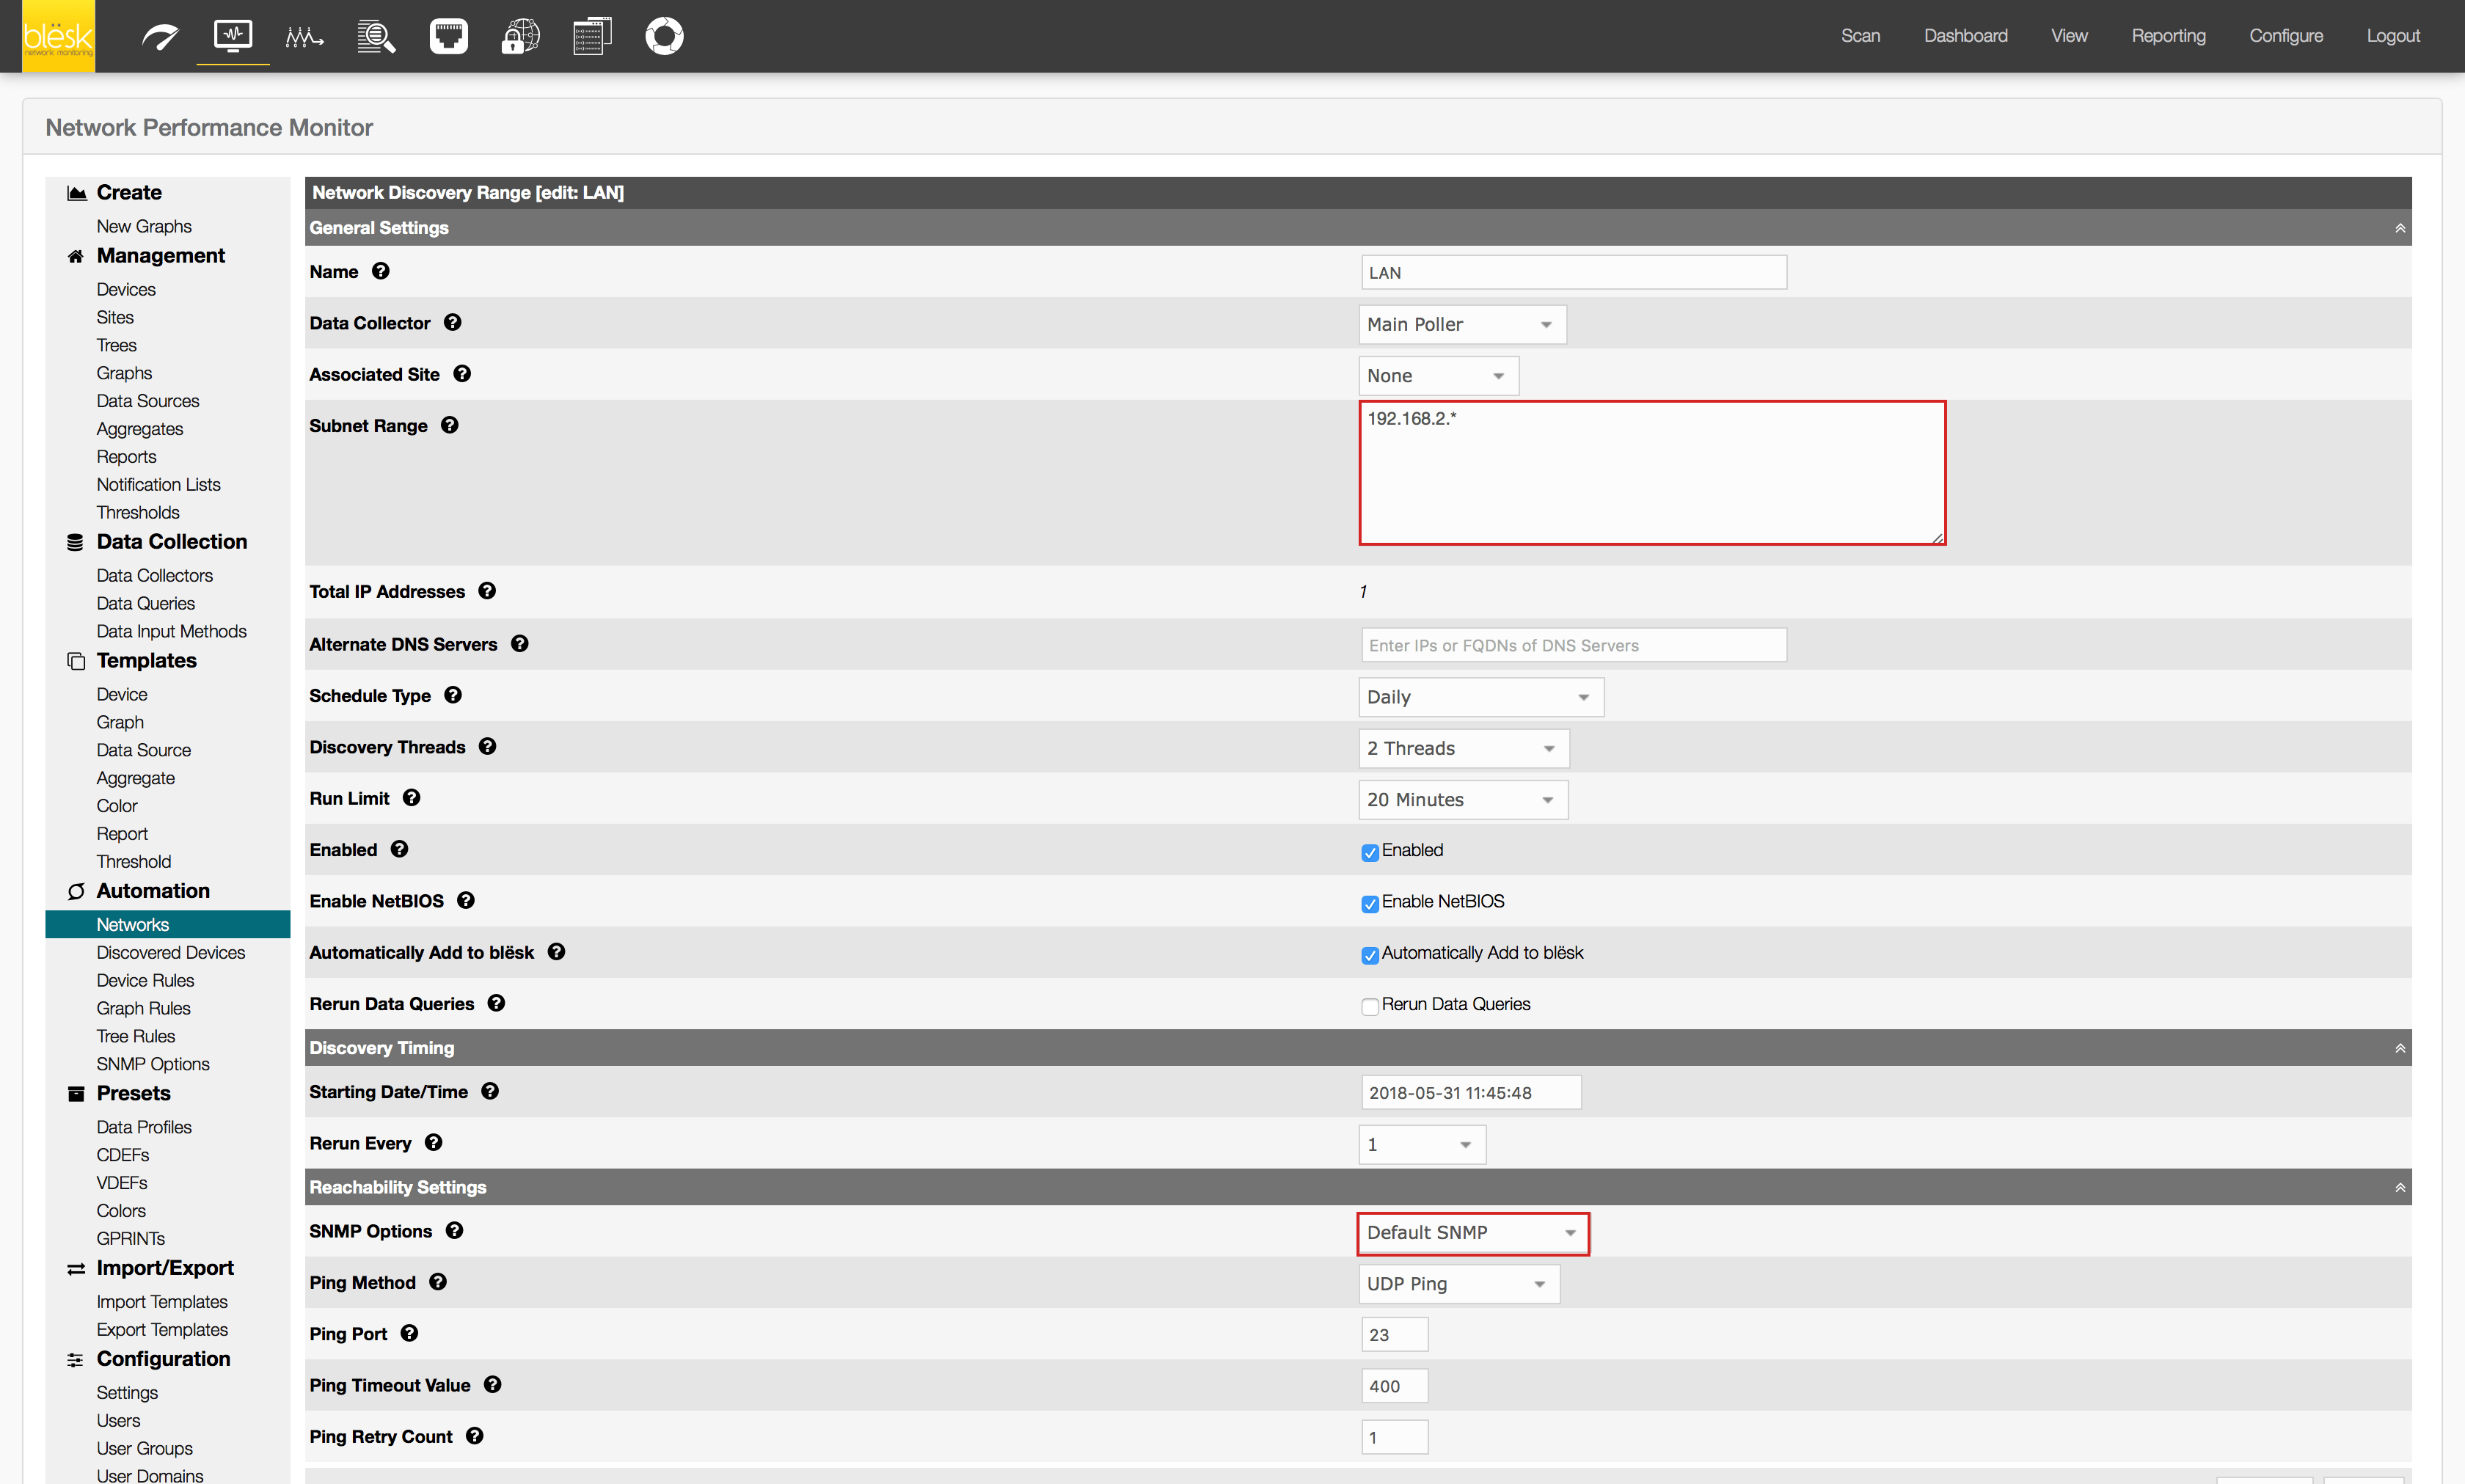
3. Add any additional subnet you would like to auto detect and import into the <<Subnet Range>> box. Use commas to separate multiple entries (e.g. 192.168.2.0/24,172.16.0.*). Wait for an hour for the Scan to start since the default frequency is set to every 1 hour.
¶ Network Traffic Analyzer (NTA)
The blësk NTA module is a sniffer program which, when correctly placed in your network, doesn’t need any additional configuration in order to make this functioning.
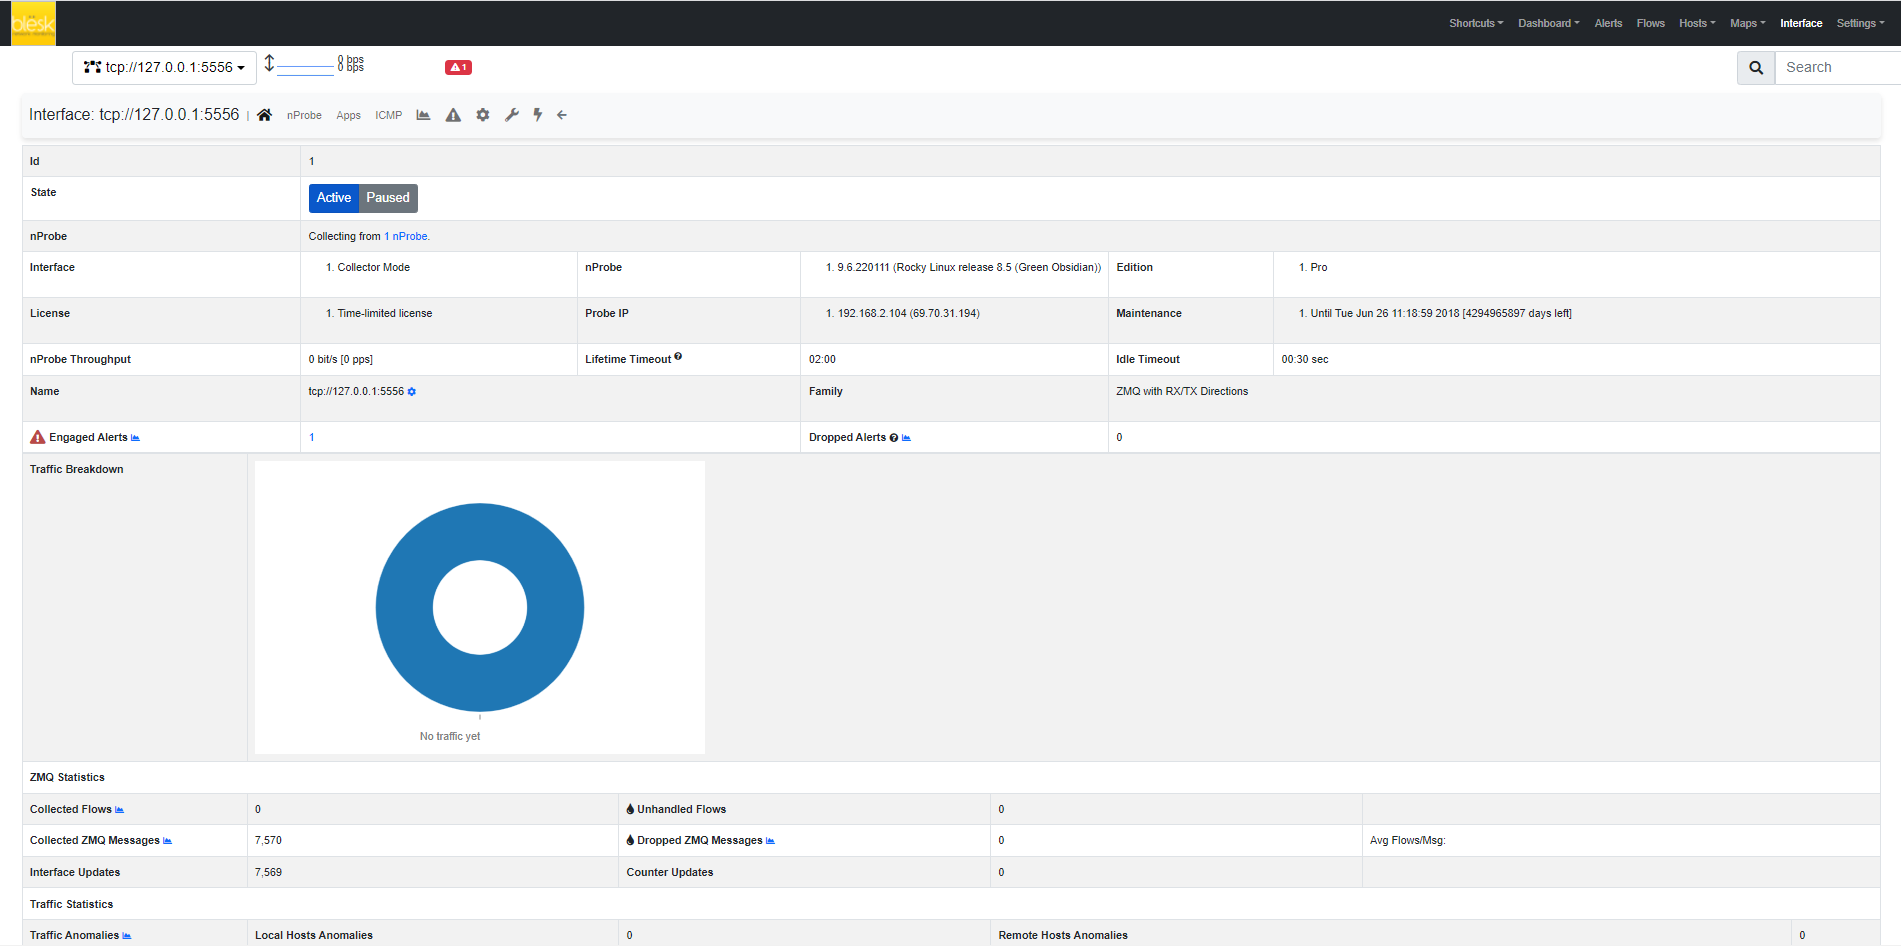
If you have followed the instructions on configuring your devices to work with NTA, then all you have to do is to listen on the NTA virtual interface, where all flow of data will appear.
1. To start this step, navigate to Network Traffic Analyzer from the home page menu.

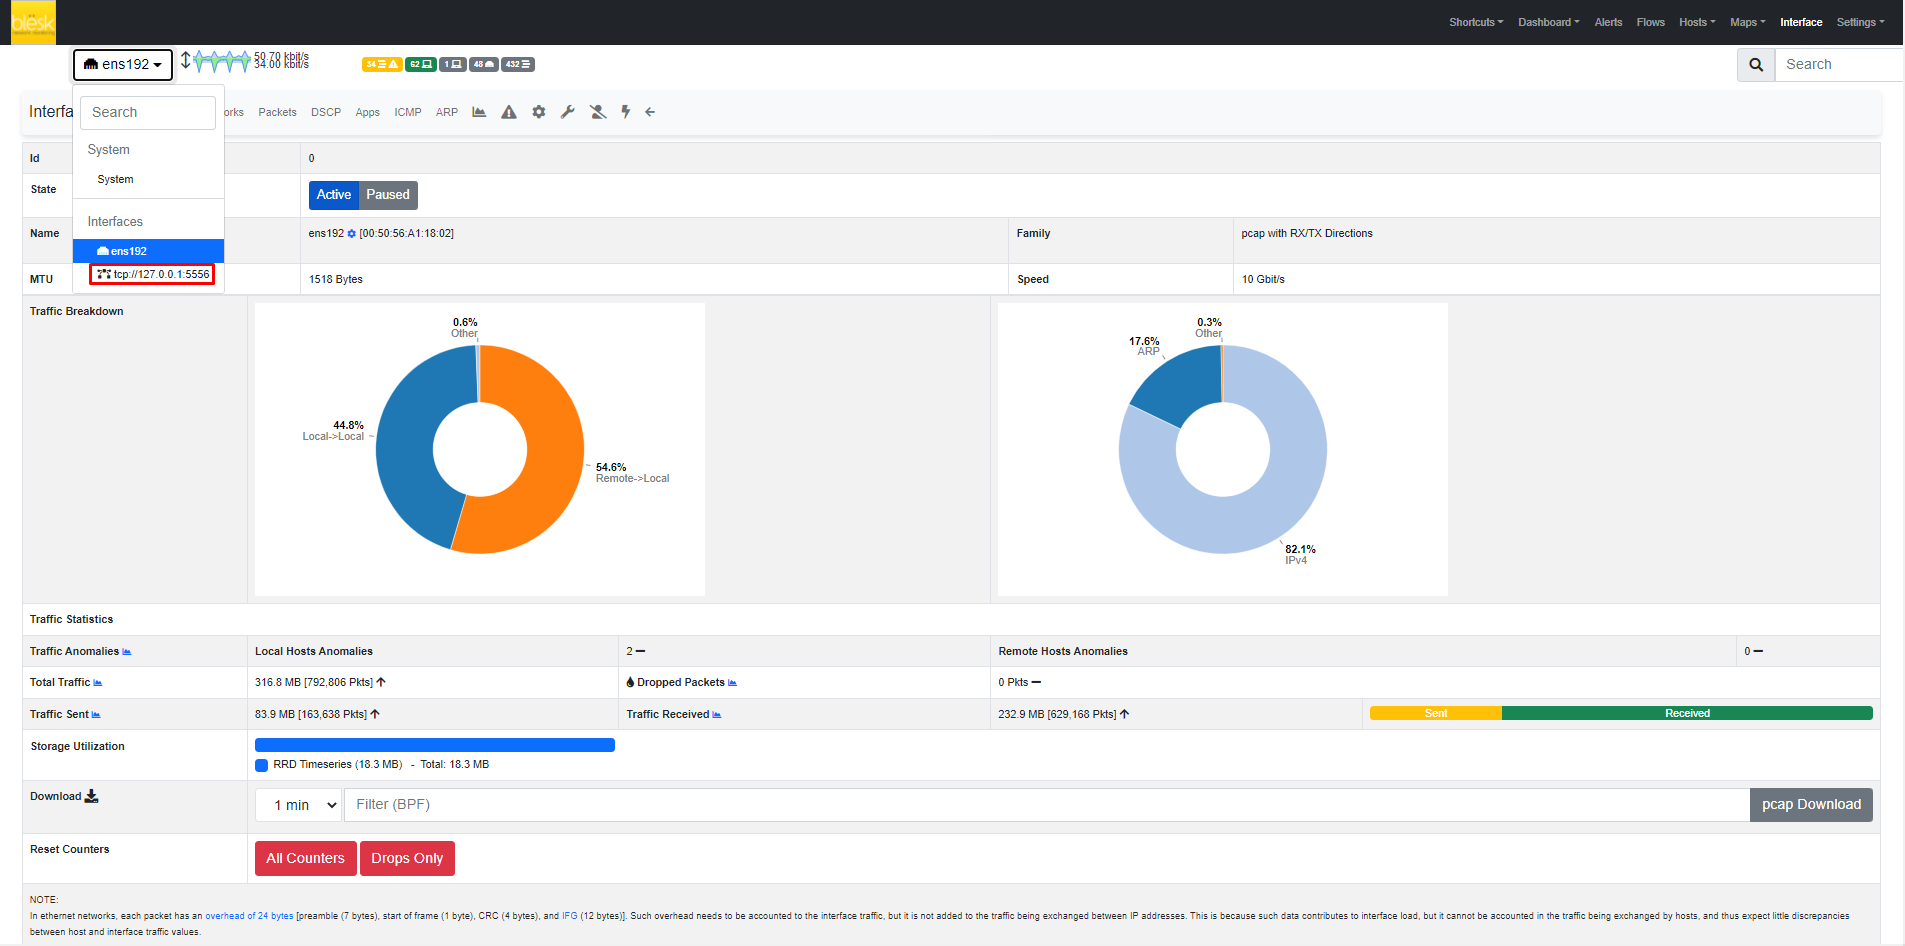
2. Then navigate to Interfaces, then click on <<tcp://127.0.0.1:5556>> virtual interface to start receiving data from the flow generators (e.g. Firewall, Switches, etc.).
⇣
¶ Event Log Manager (ELM)
Navigate to Event Log Manager (ELM) from the homepage menu.

1. ELM has been configured to archive data logs received in four distinct index locations.
Here are the index names we have chosen during configuration:
- network – for all data logs received on port 514 (e.x. Switches, UPS, SAN, Unix Servers, etc).
- fortigate – for all data logs received on port 513 (works with FortiGate, Cisco and SonicWall).
- winlogbeat – for all data logs received on port 5044 (works with all Windows systems).
- meru – for all data logs received on port 517 (works with Meru WiFi devices).
[Note: If the indexes do not appear, this means that no data is being received on the corresponding port for the index. In this case, please review the document on how to configure your devices to send logs to blësk.]
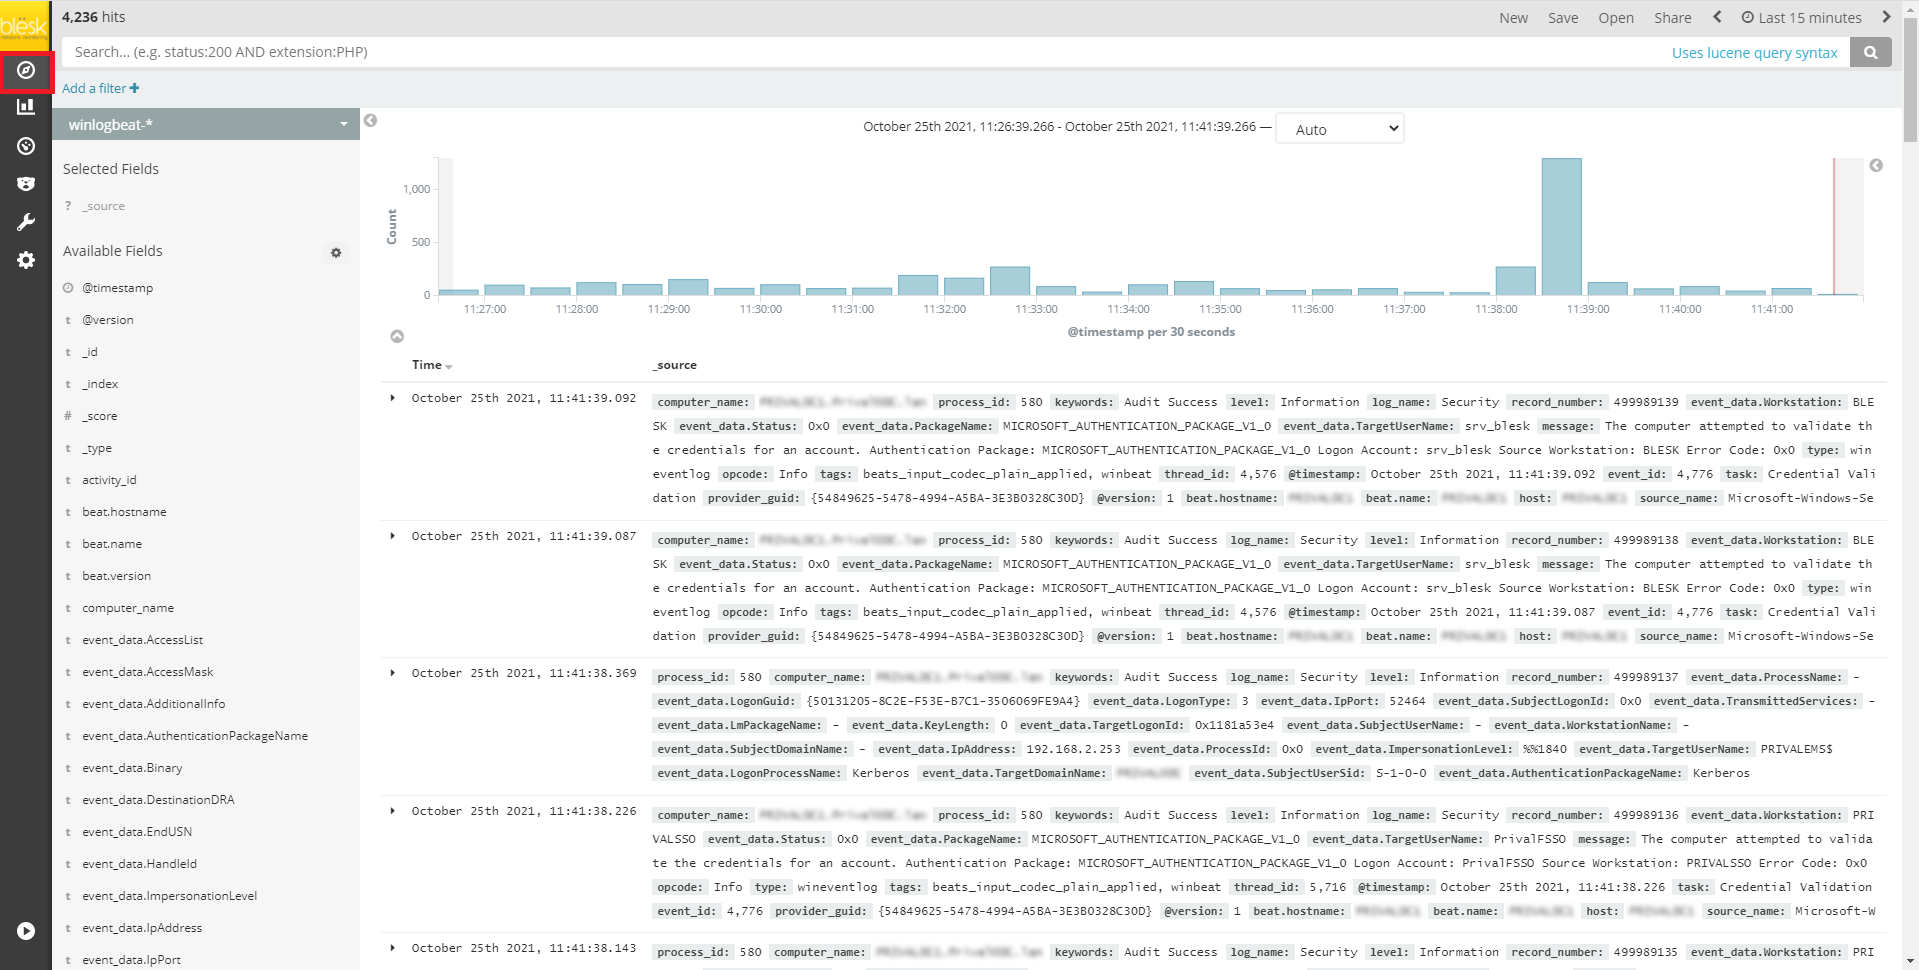
2. To view data received to blësk, click discover button from the left menu bar.
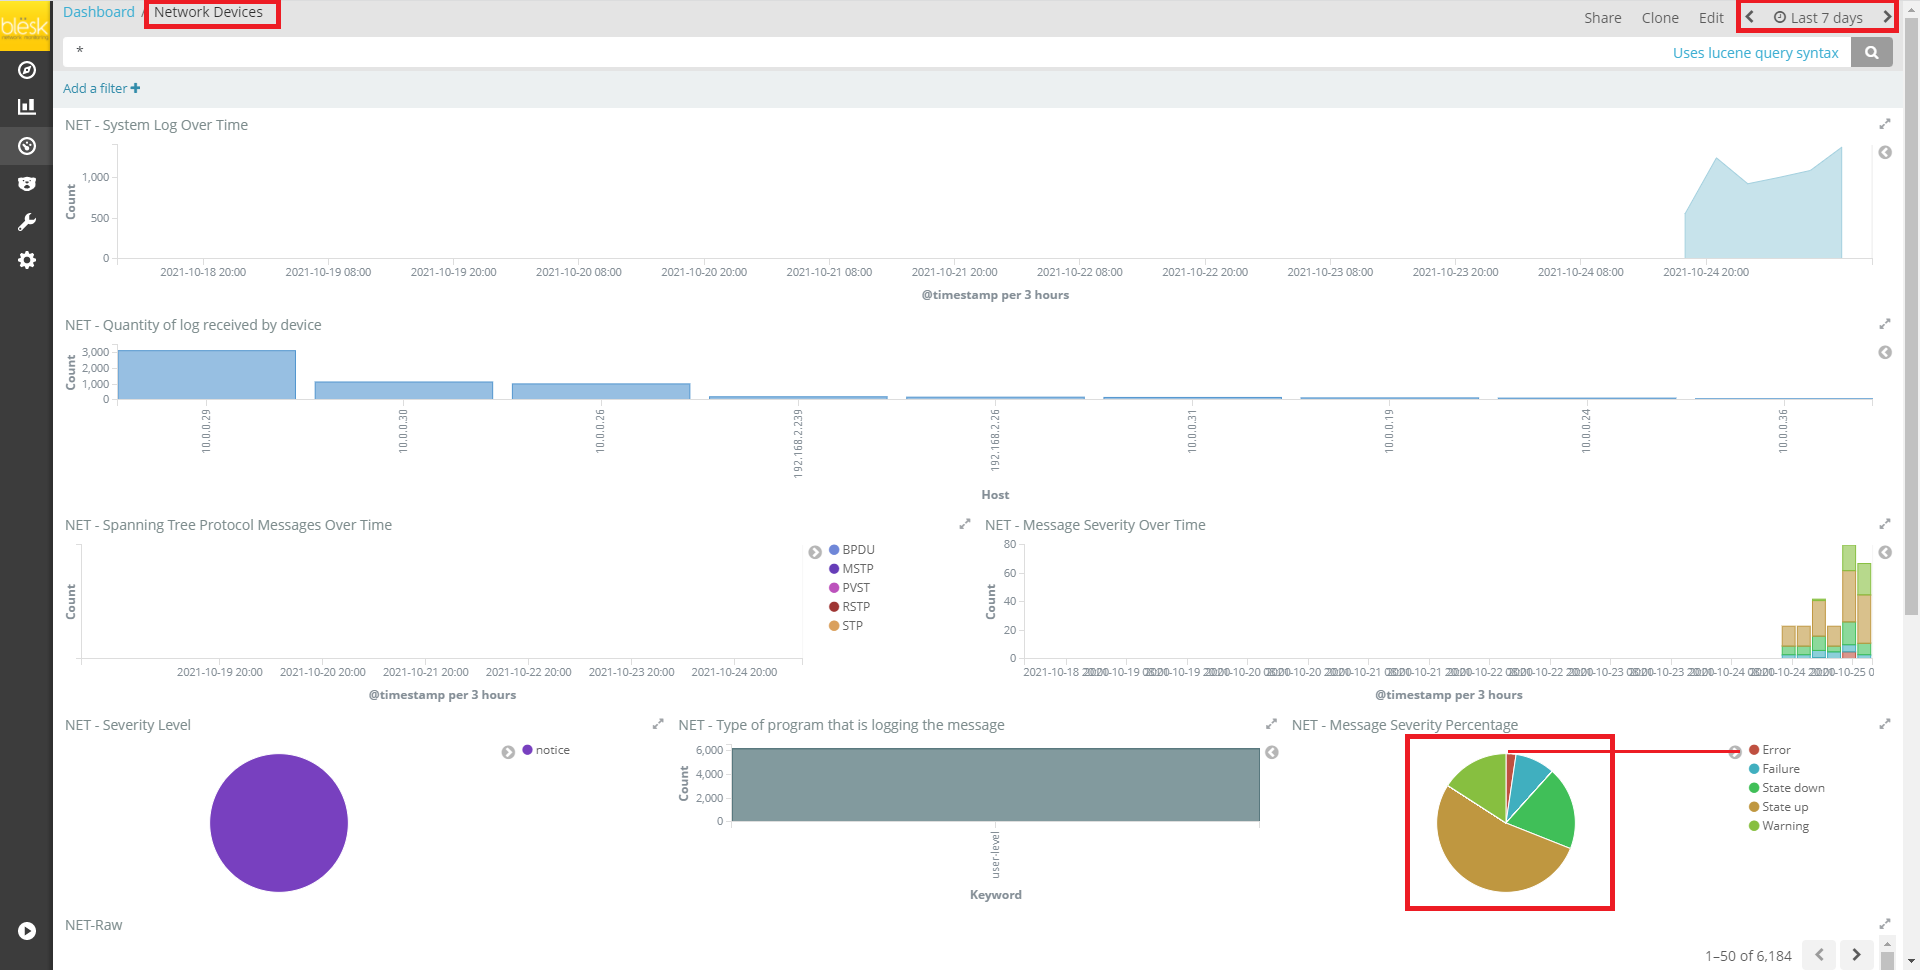
3. To access ELM Dashboard, click Dashboard from the left menu bar. From this screen, you will find the options to choose from.

4. For demonstration purposes, the Network Devices option has been selected to navigate to the Network Devices monitoring page. This page is the graphical interpretation of data received in the blësk server.
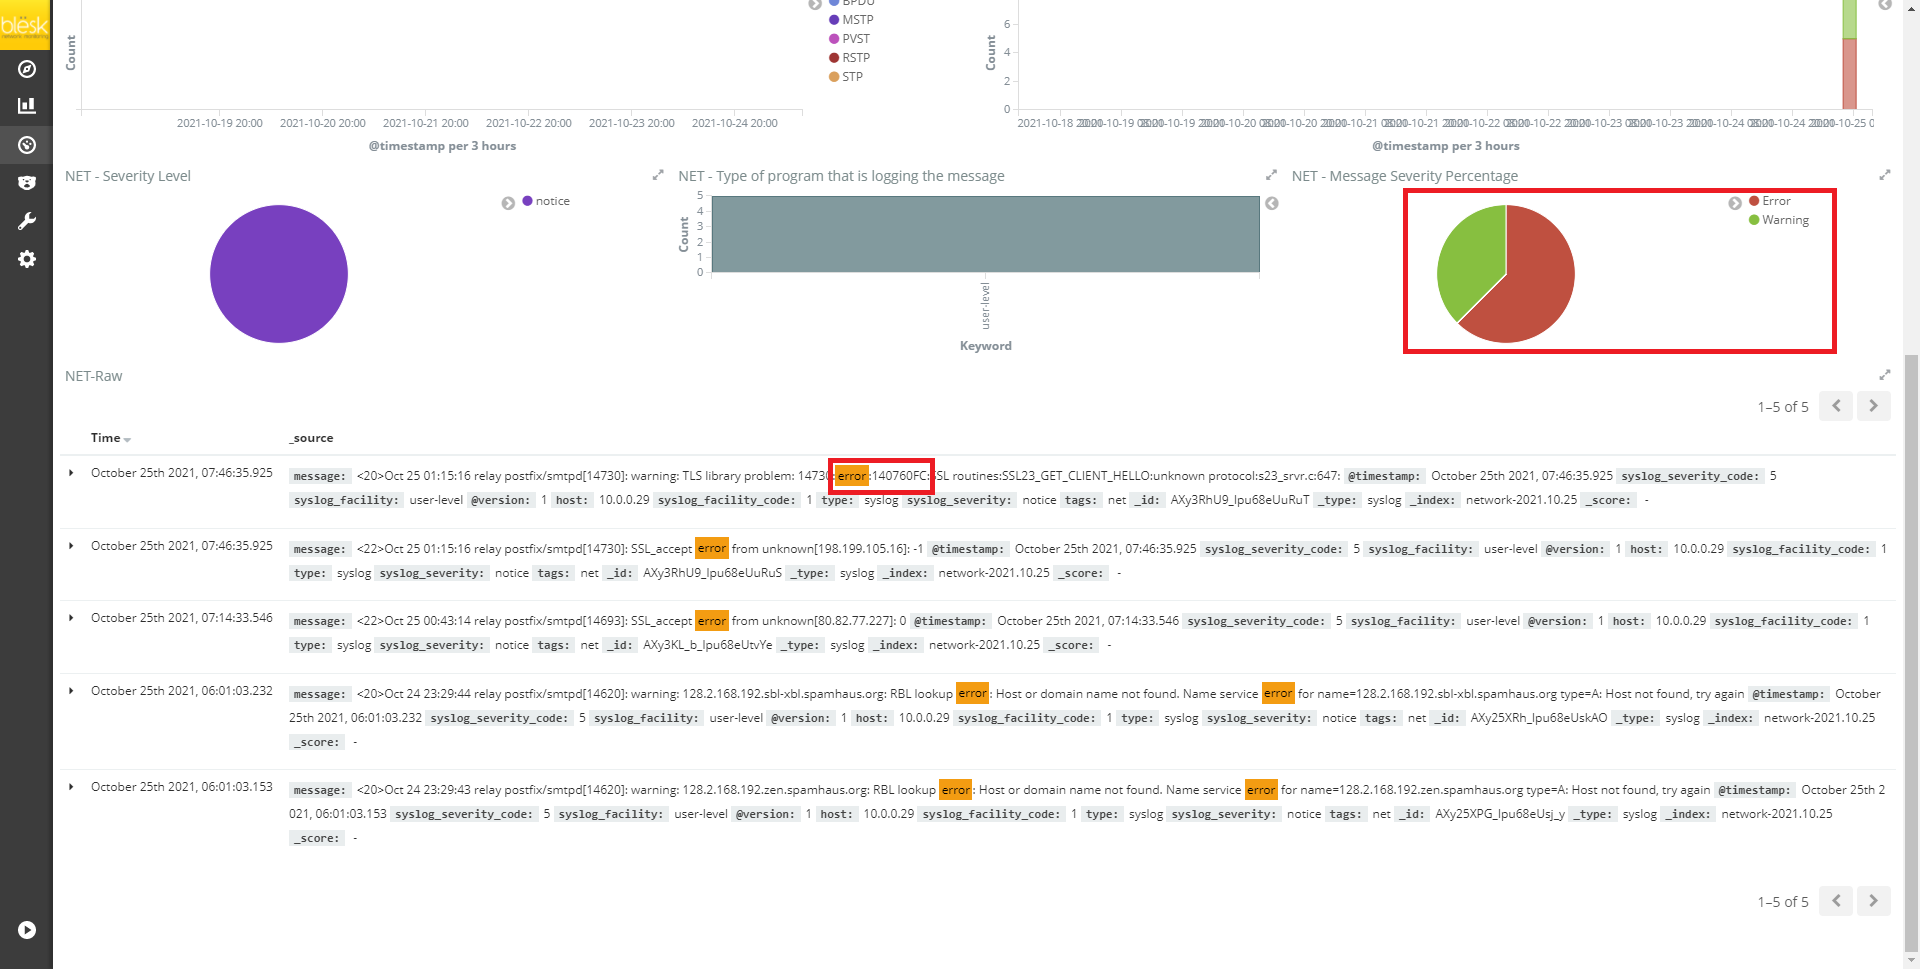
To investigate an Error or Warning, click on the appropriate slice from the pie chart as shown in the Image - 17 below.
To narrow down the search result, click on the flagged host IP and scroll down to read specific error messages related the event as shown on Image - 18 below.
5. To narrow down the search results, this page allows to filter results by date/time range. To filter, click on the date filter options as shown on the Image - 19 below.

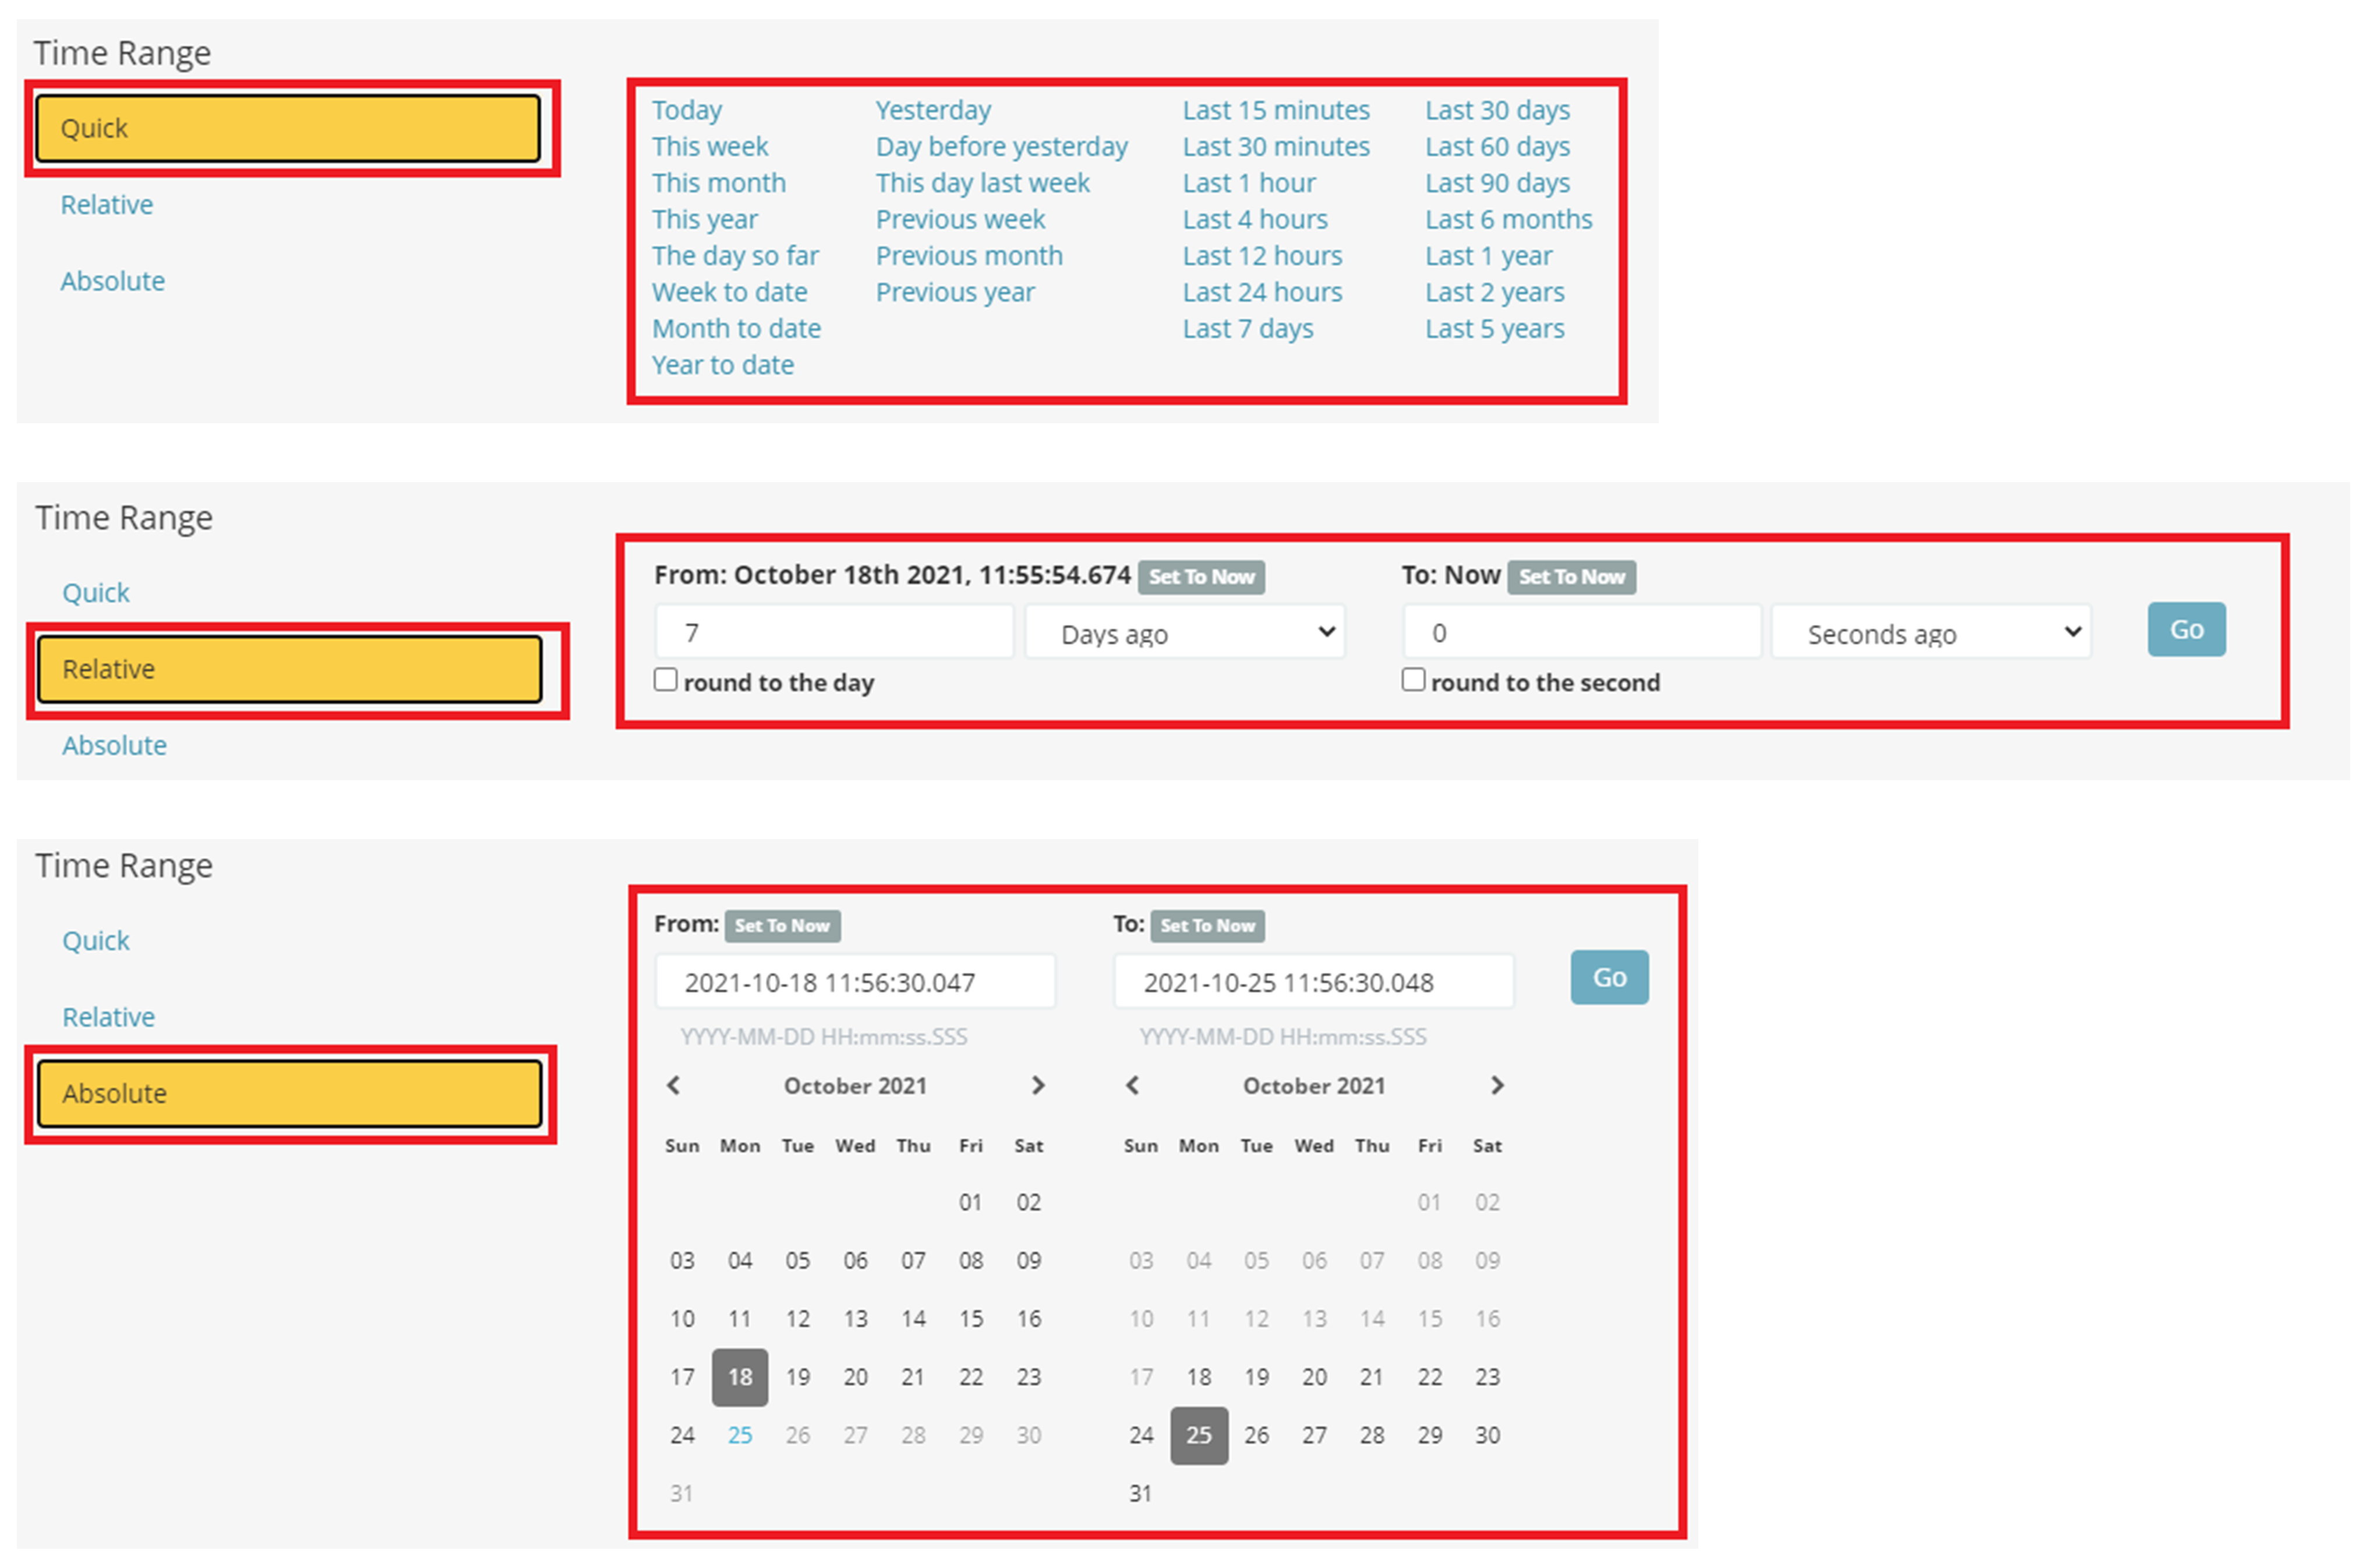
Users can filter the Time Range by selecting Quick, Relative or Absolute options as show on the Image - 20 below.
¶ Switch Port Manager (SPM)
The blësk SPM module requires the SNMP protocol, which should have already been defined and configured during the installation. The auto detection part of the software will handle all the jobs related to automatic importation, so there should be nothing for you to do except assuring that CDP or LLDP protocol is correctly activated on all switches.
Also, if some of your devices reside behind a firewall, you will need to start a new scan detection by using the IP address of the switch behind your firewall on the other side.
1. Navigate to Switch Port Manager (SPM) from the homepage menu.

2. Click Scan from the top menu bar, then enter the IP address of your switch behind the firewall.

¶ Network Security Monitor (NSM)
Vulnerability Management Service is a core service required to protect your critical business systems from compromise. Network Security Monitor (NSM) is a full-featured scan engine that executes vulnerability tests and PenTest against target systems. NSM allows scanning devices for vulnerabilities within the network by performing scheduled or manual scans. Vulnerability scans are conducted based on daily updated and comprehensive public feeds of Network Vulnerability Tests (NVTs), Common Vulnerabilities and Exposures (CVE), and Common Platform Enumeration (CPE).

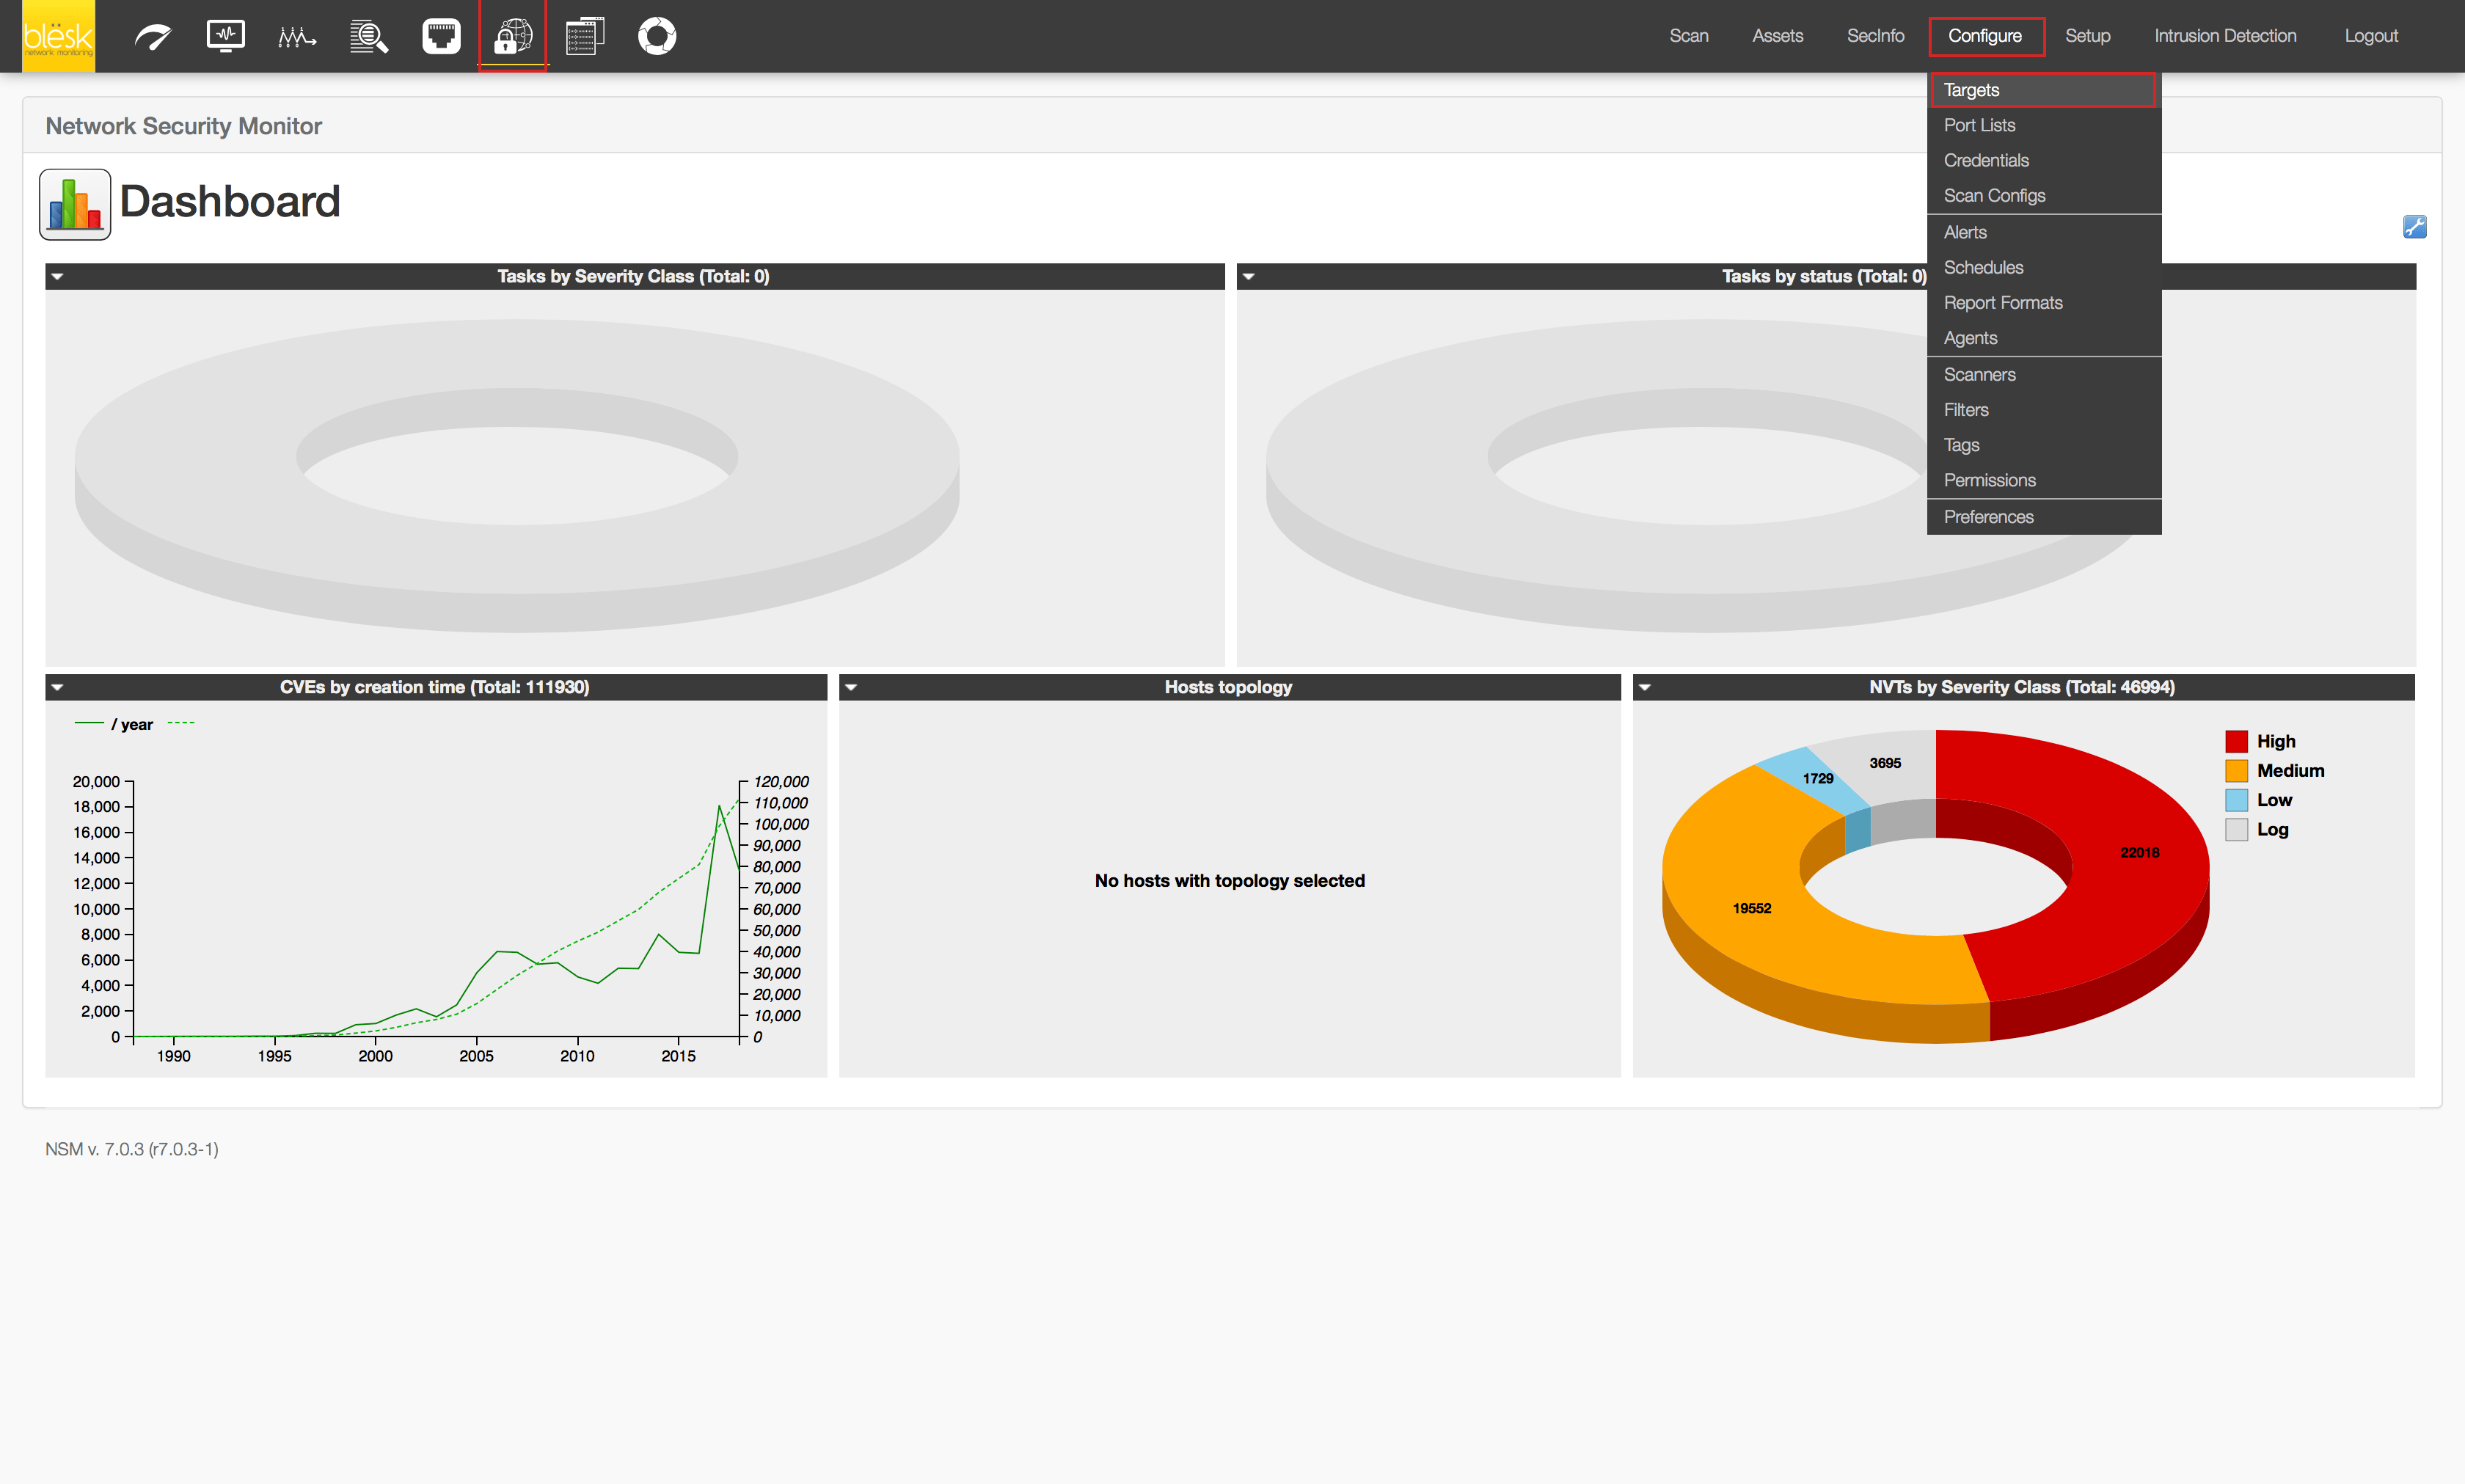
1. Go to Configure > Targets to define the IP address range to scan.
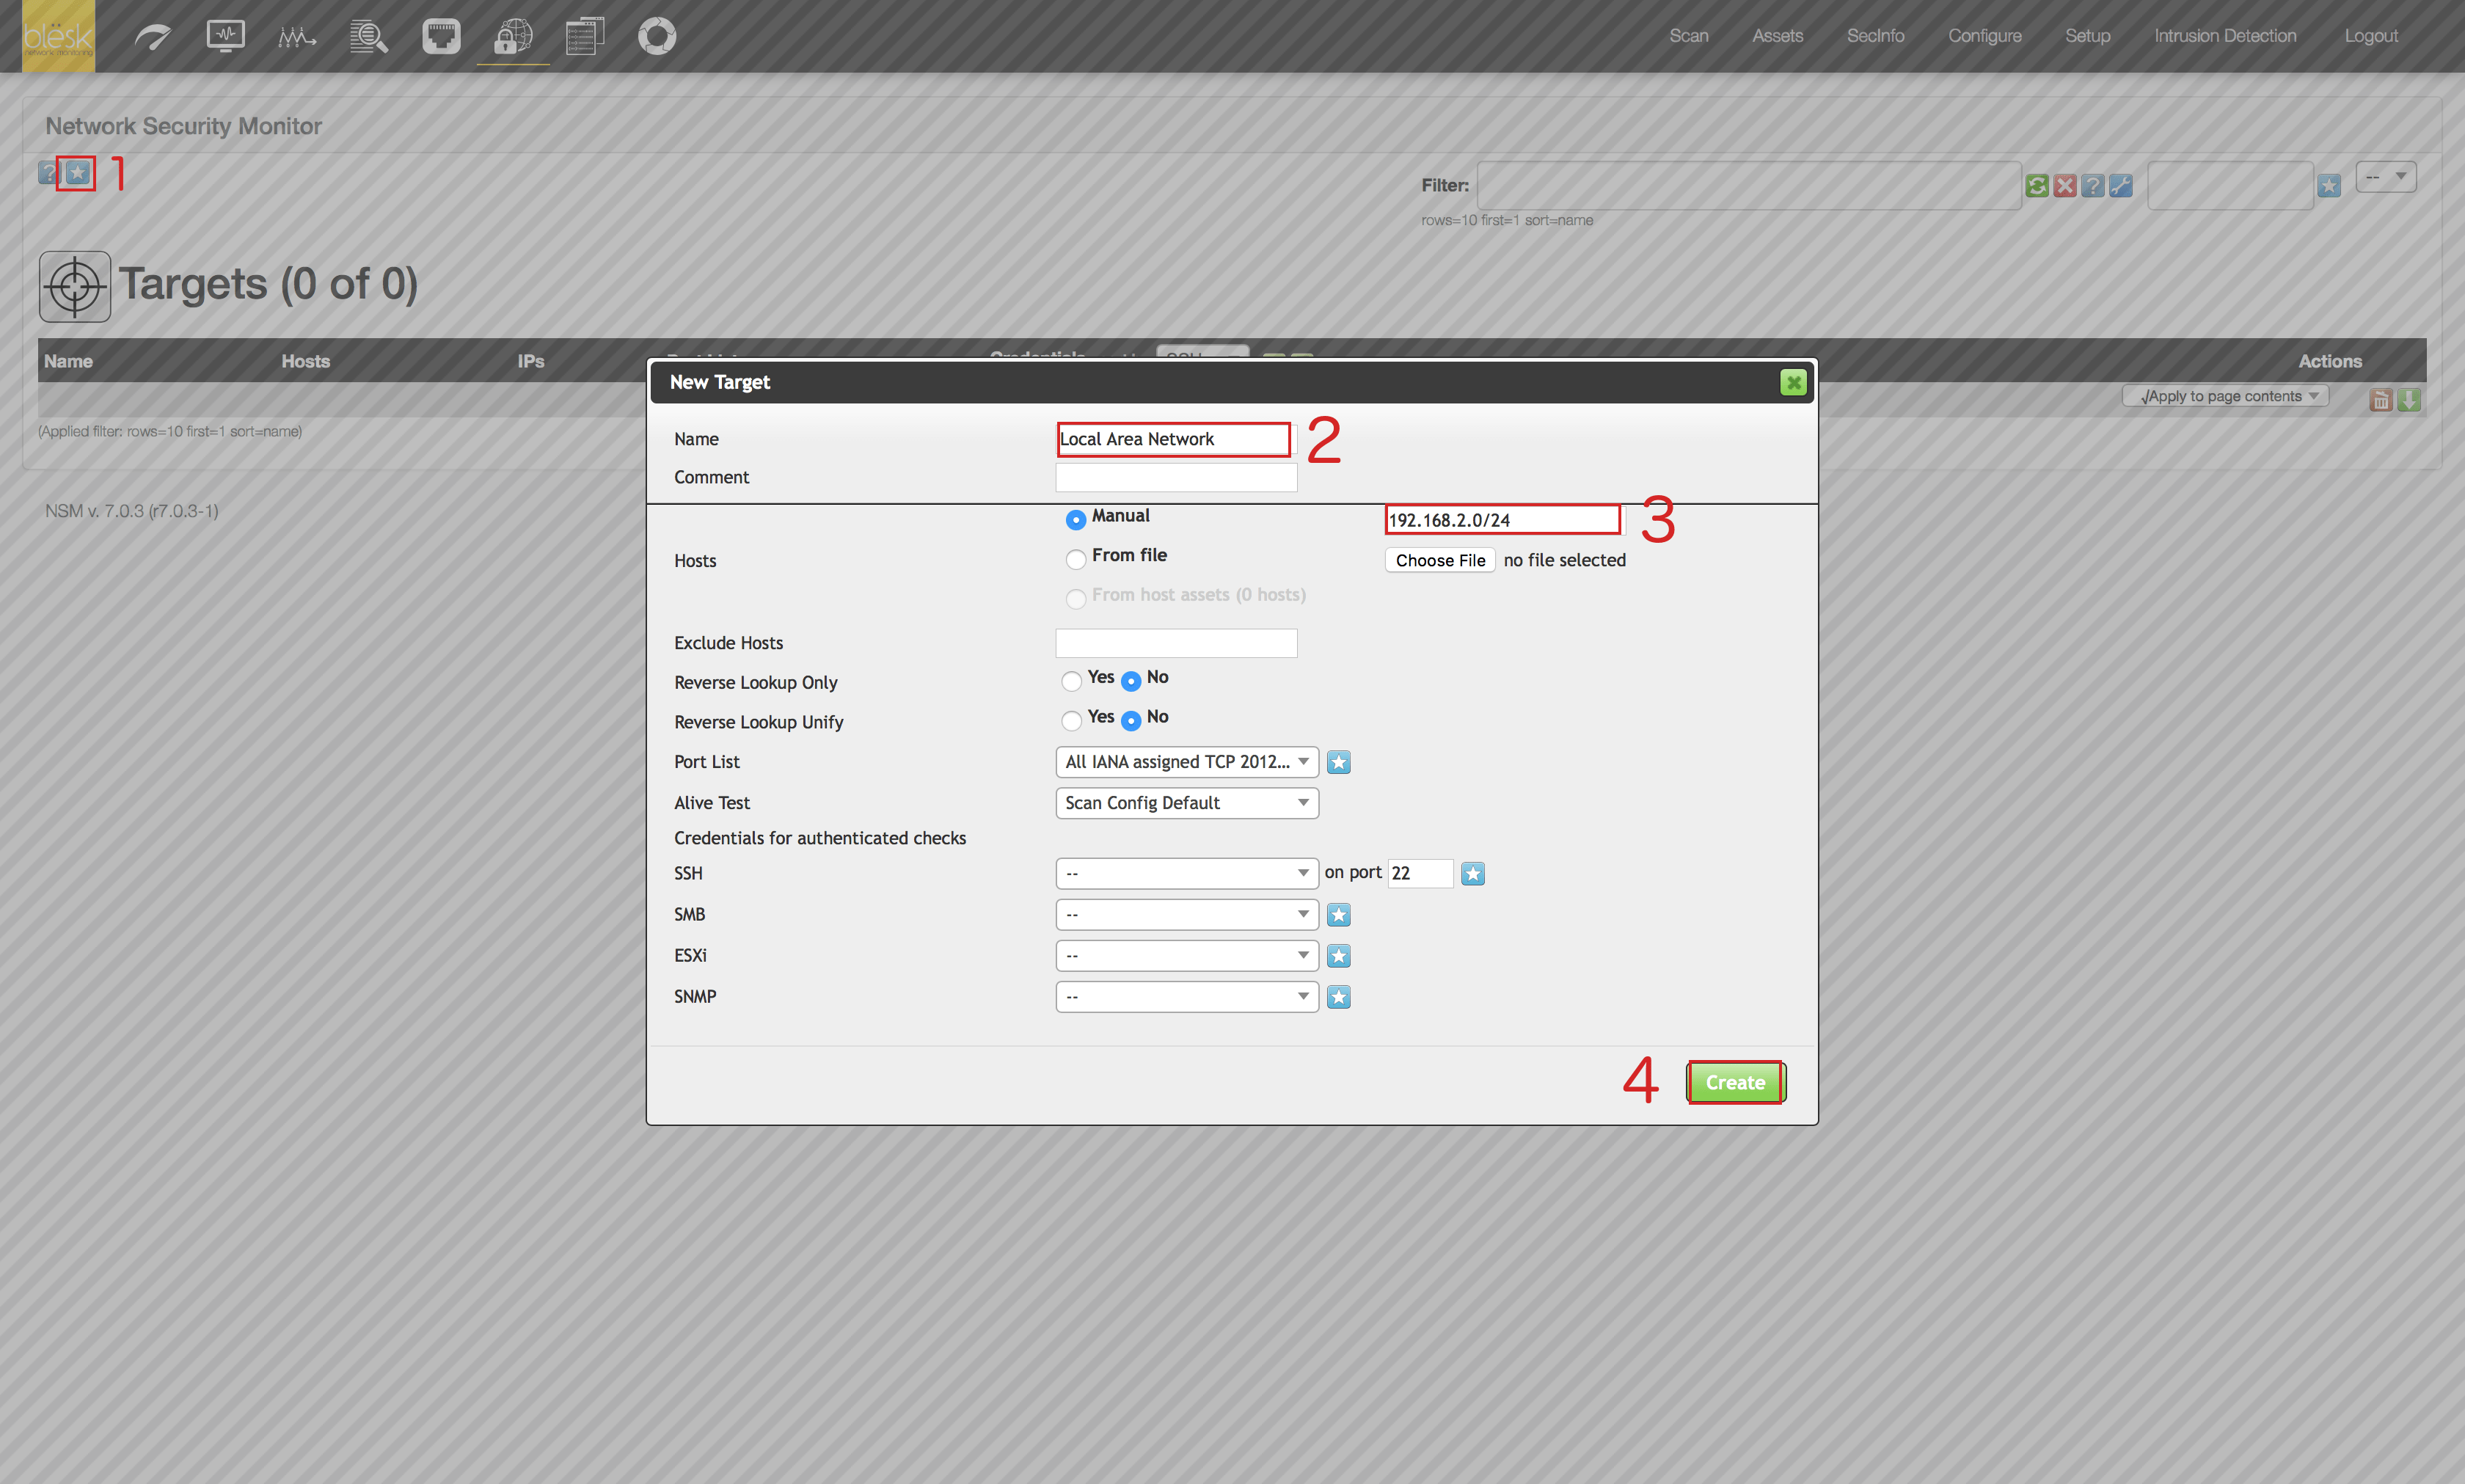
2. Once on the “Targets” page, click on the blue icon representing a star located at the upper left of the page (1). Then enter the name you want to give to this IP Network range (2), then provide the IP range information (3) and click on the “Create” button (4).
3. Now we have to define a schedule for the scan to know when to start. Click on Configure>Schedules.

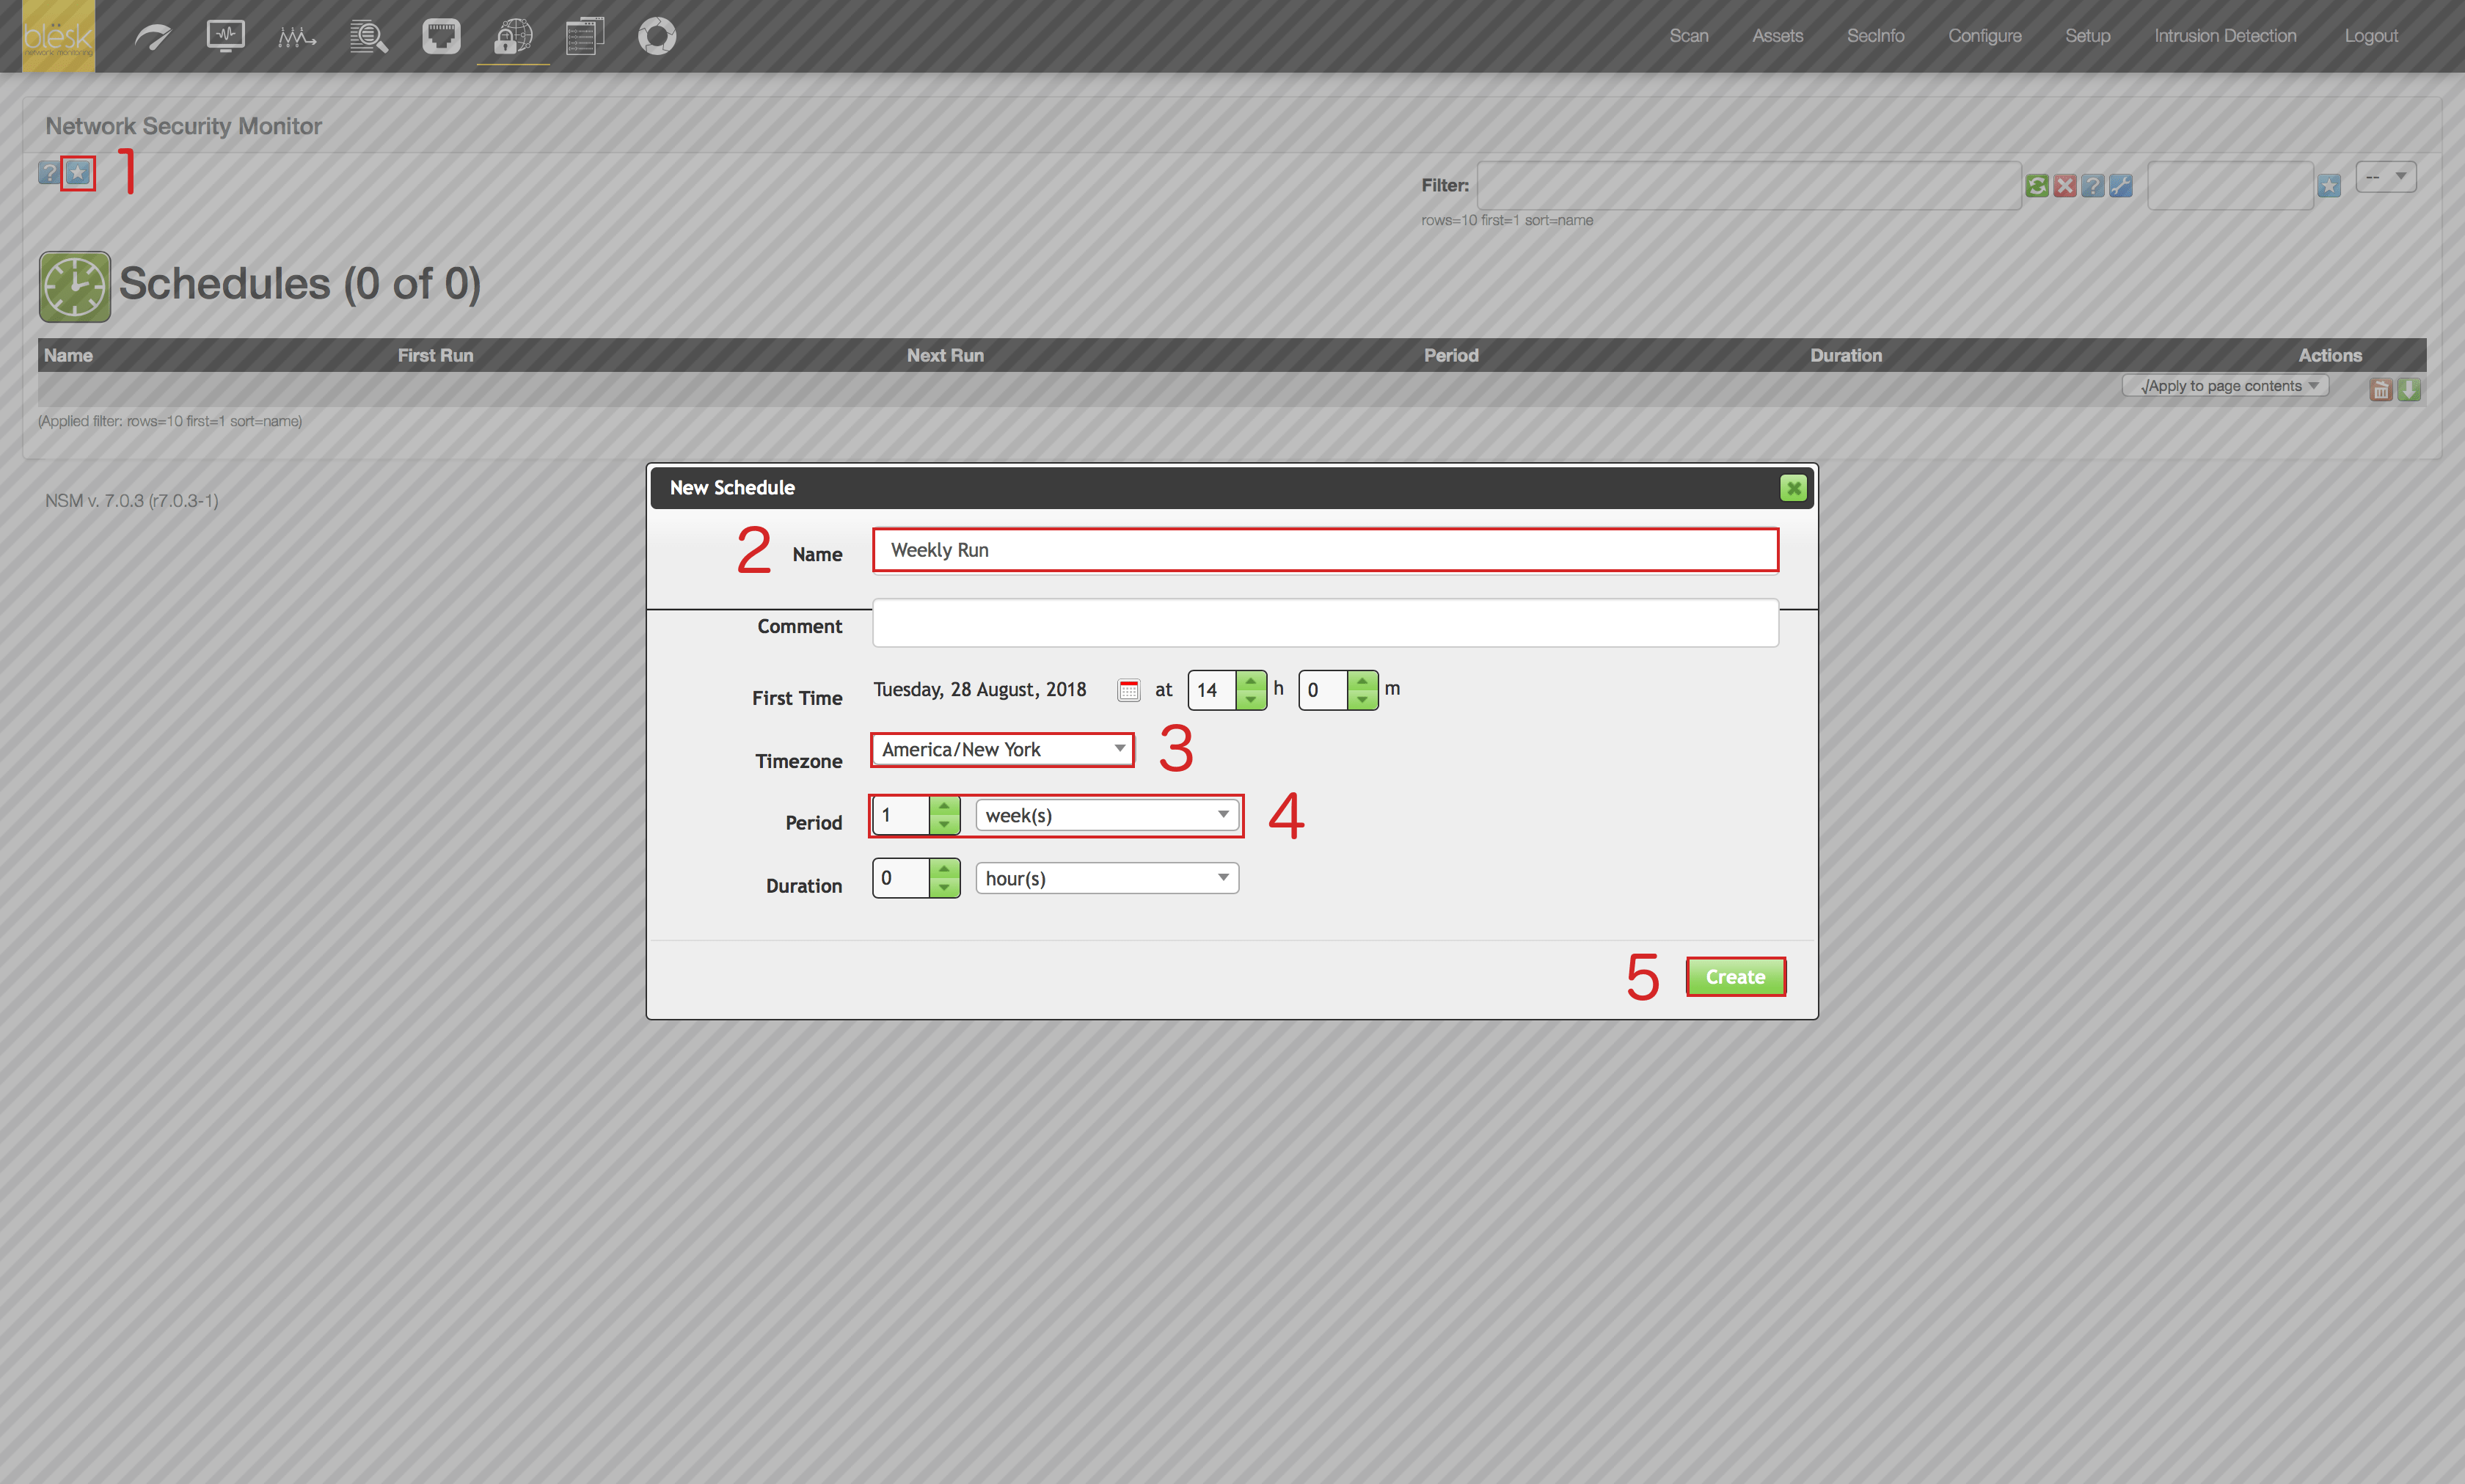
4. Once on the “Schedules” page, click on the blue icon representing a star located at the upper left of the page (1). Then enter the name you want to give to this schedule (2), then provide your time zone information (3), the period for the schedule, in our case it’s 1 week (4), and click on the “Create” button (5).
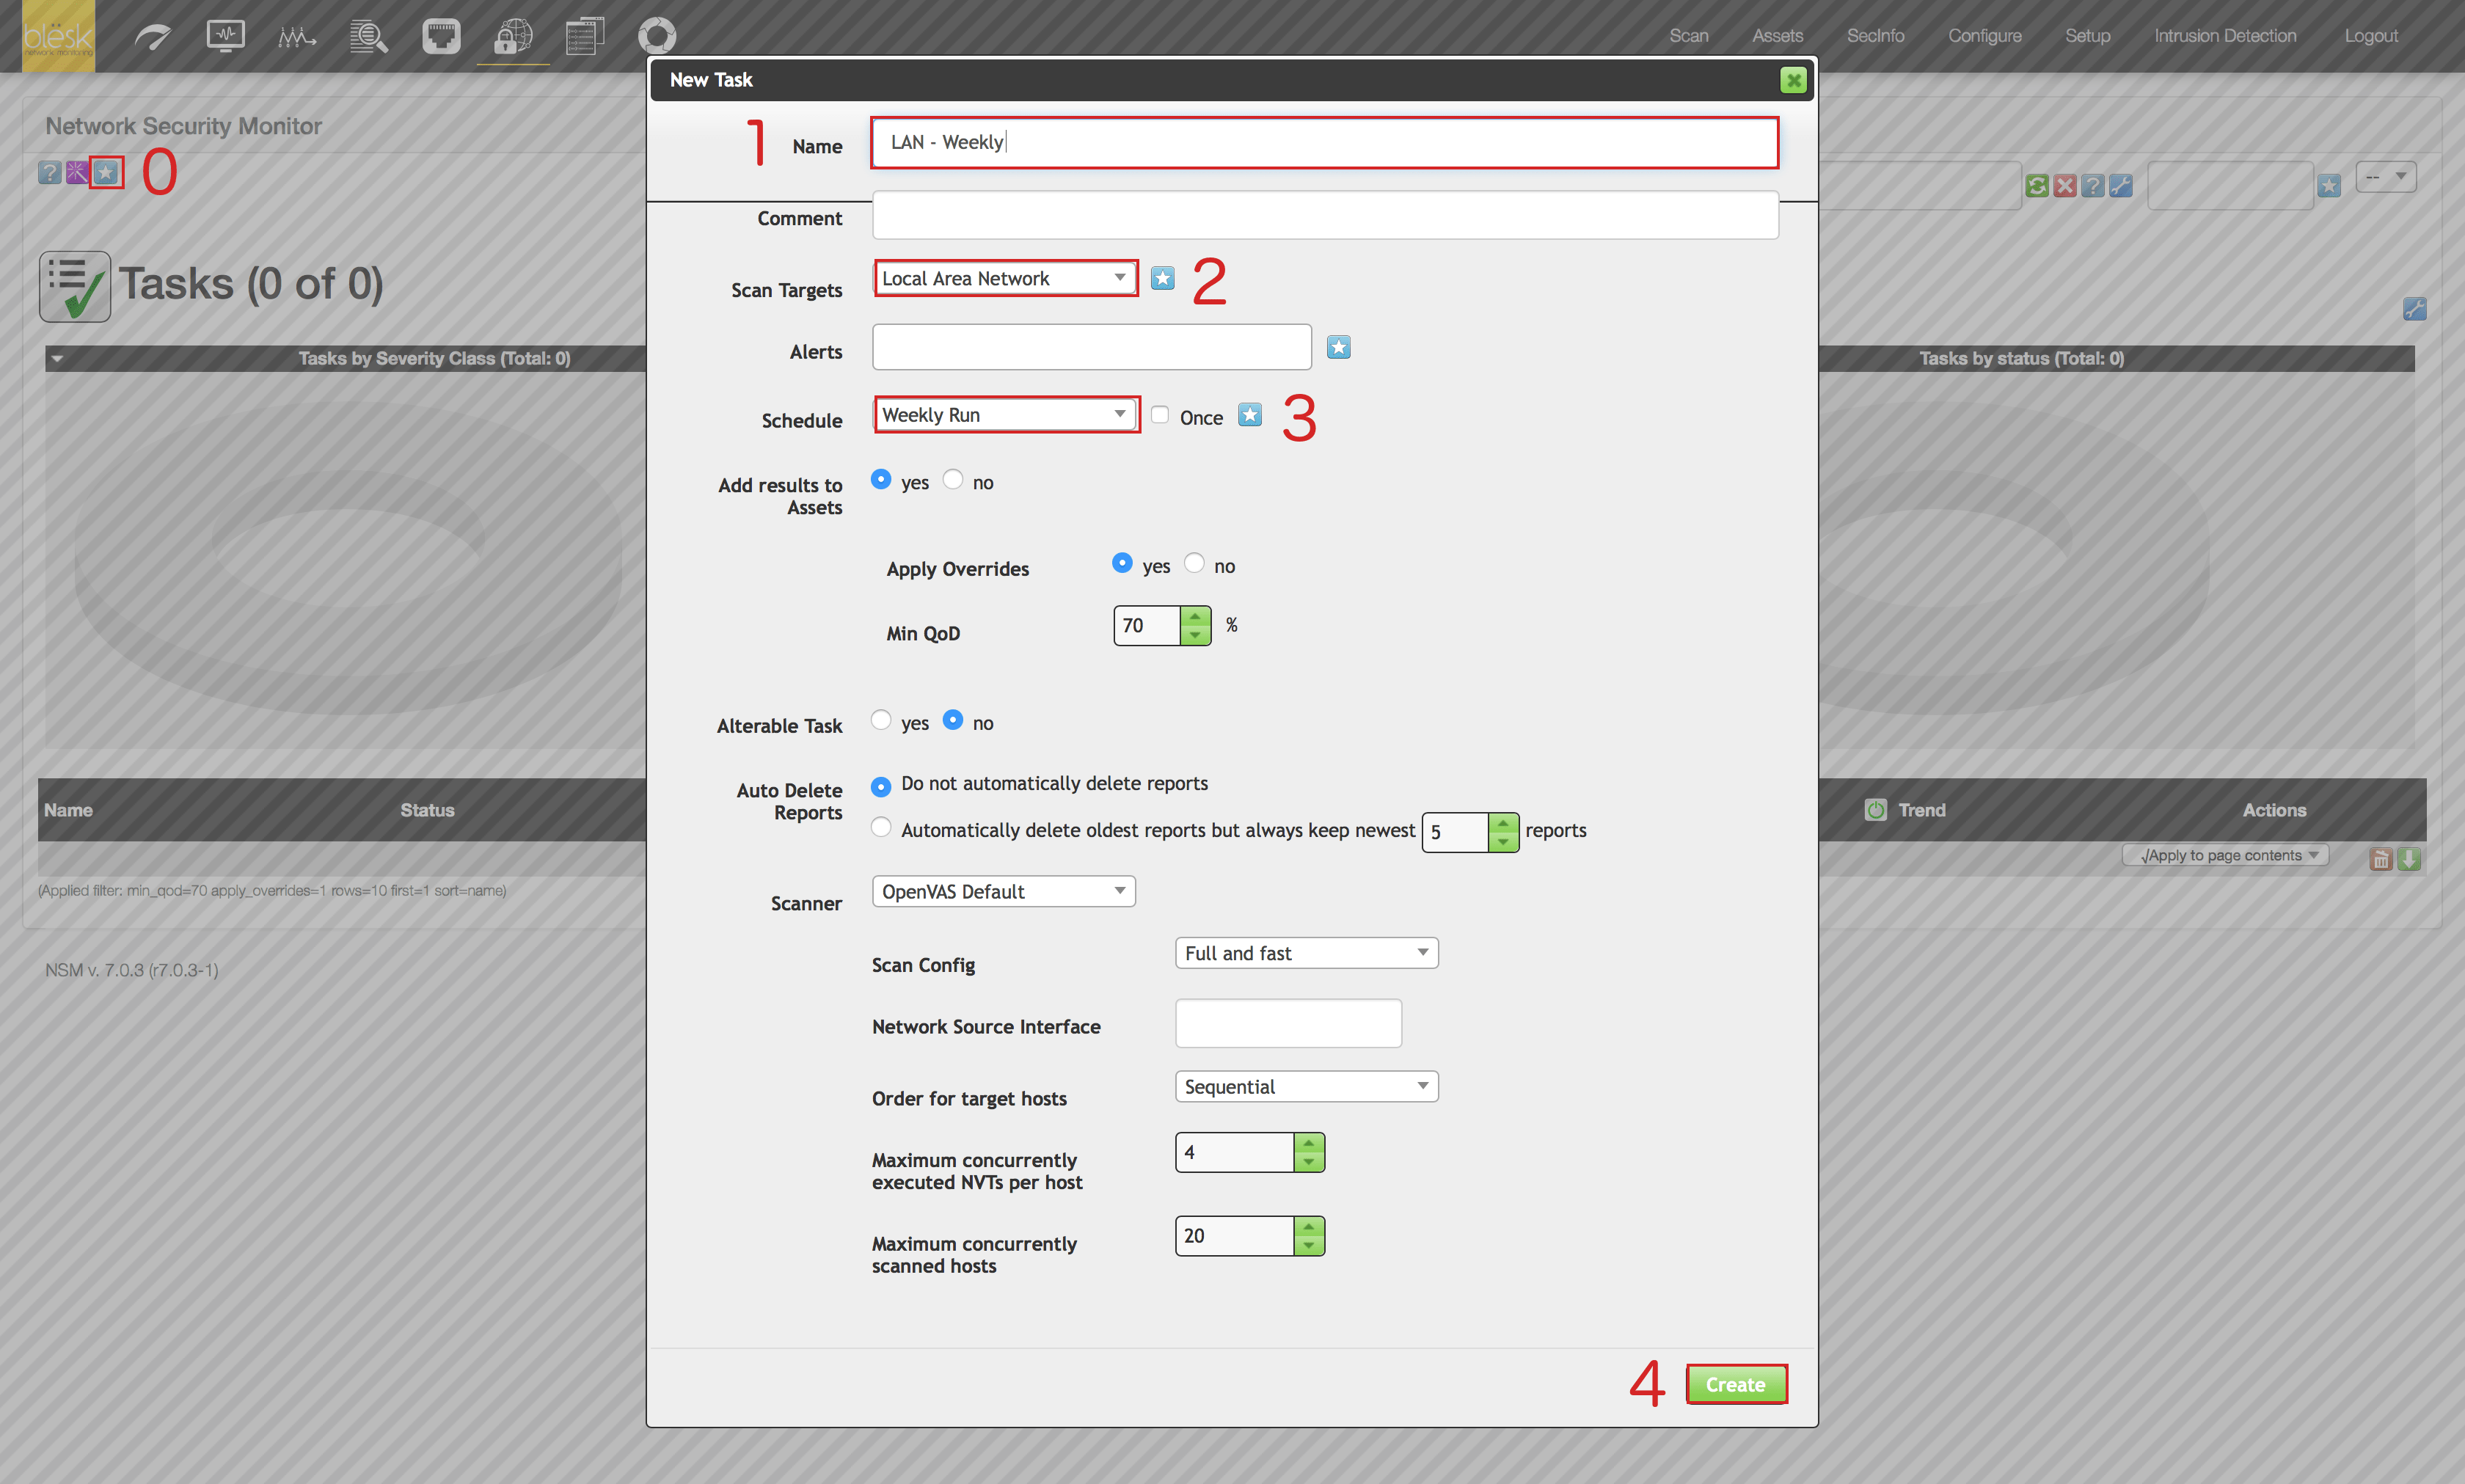
5. Finally, create the task that will do the job. Click on Scan from the top right hand menu and then Tasks.

7. On the “Scan” page, click on the blue icon representing a star located at the upper left of the page (0). Then enter the name you want to give to this task (1), then select the target we previously created from the drop down list(2), same thing for the schedule (3), and click on the “Create” button (4).
¶ Network Configuration Manager (NCM)
The blësk NCM module requires SSH or Telnet access with a valid Username, Password, or Enable Password to work. Those credentials should have already been defined and configured during the installation or later under Auto Detection.
The auto detection part of the software will handle all the jobs related to automatic configuration checks and backups, so there should be nothing for you to do.

⇣

¶ Asset Life Manager (ALM)
One of the primary functions of ALM is to keep track of your hardware and software assets. These assets can be entered manually in the Inventory section or they can be imported automatically with the help of an agent installed on the workstations and servers in your organization.
One such tool is the Windows Agent, which is available for download from this URL.
1. Here are the instructions for manually installing the agent for Windows based systems in CLI. For a mass deployment, read this page. Change: << your_blesk_server_address >> for the URL of your blësk server.
msiexec.exe /i GLPI-Agent-1.6.1-x64.msi /passive RUNNOW=1 NO_SSL_CHECK=1 SERVER=https://your_blesk_server_address/glpi/plugins/glpiinventory/2. Once the agent is installed, you can verify the results in the ALM section of your blësk server. Go to <<Asset Life Manager>> from homepage menu.

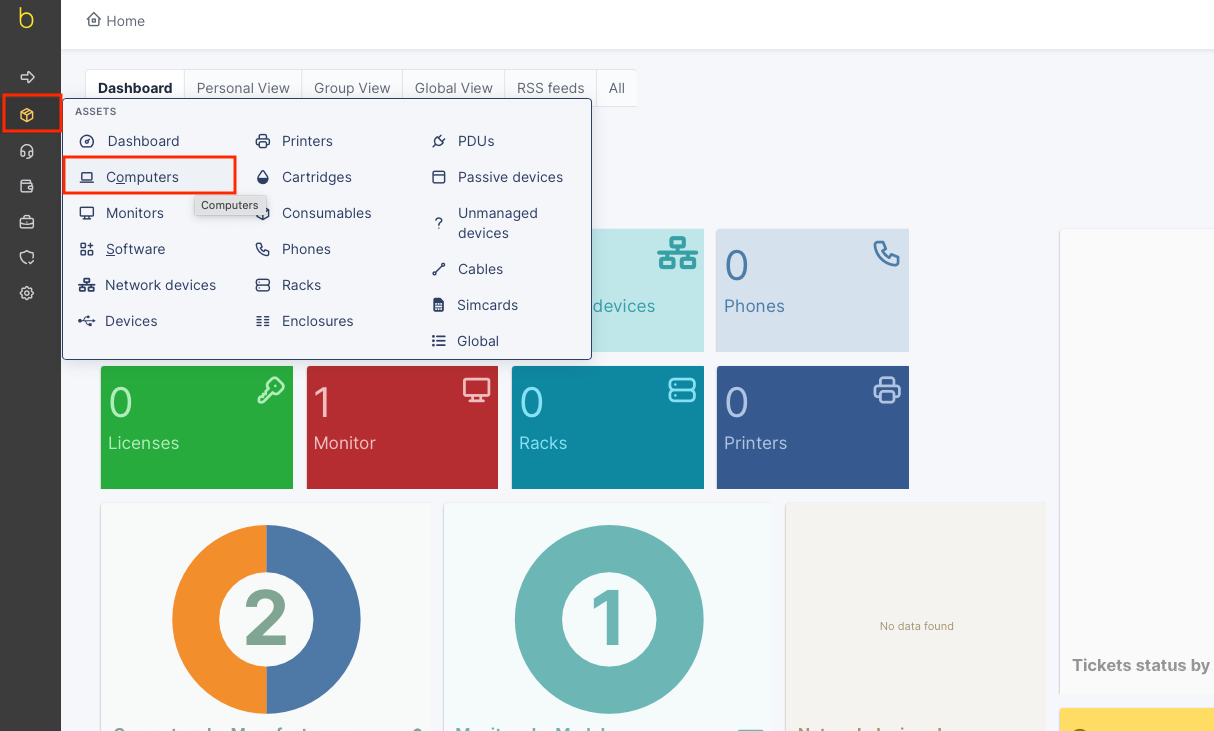
3. Click on Assets > Computers from the left menu bar.
